

Most websites lose visitors not because of flashy design or missing features, but because people's brains shut down halfway through. They're overwhelmed, confused, or exhausted by too many choices, unclear instructions, or competing messages fighting for attention. The problem is that your analytics dashboard doesn't explain why this happens, only that it does. To fix it, you need to hear directly from your visitors about what breaks their focus and makes them leave. Gathering user insights on cognitive load is the bridge between knowing you have a problem and actually solving it.
TL;DR:- User surveys uncover which specific elements create mental strain for real visitors
- Usability testing reveals cognitive barriers in task completion and decision-making
- Heatmaps and session recordings show where users struggle, pause, or abandon
- Combining these methods surfaces patterns that analytics alone cannot detect
- Insights drive targeted optimizations that improve both comprehension and conversion
What is cognitive load and why measure it?
Cognitive load is the amount of mental effort required to complete a task on your site. When it's low, people move through your flow effortlessly. When it's high, they hit a wall: they abandon the checkout, skip signing up for a trial, or bounce back to Google.
The challenge is that cognitive load isn't visible in standard analytics. You see a drop-off; you don't see that three competing CTAs on the same section confused the visitor, or that jargon in your copy derailed comprehension. You need direct evidence from users about how they experience your website.
This gap between what metrics show and what users actually feel is where research methods come in. User surveys, usability tests, heatmaps, and session recordings all supply different angles on the same problem. Together, they paint a picture of cognitive friction that no single tool can reveal alone.
How user surveys identify cognitive friction
User surveys ask people directly: What confused you? What made you hesitate? What did you skip because it seemed too complicated? These first-person accounts are gold.

A well-designed survey captures cognitive load using open-ended and scaled questions:
- Open-ended: "What part of this page felt unclear or hard to understand?" This generates raw, unfiltered feedback about specific friction points.
- Scale-based: "On a scale of 1–10, how much mental effort did you need to complete this task?" Aggregated scores reveal whether the problem is widespread or isolated.
- Task-specific: Ask about particular features: "Did the pricing comparison table make it easy or hard to choose a plan?" This narrows focus.
Real example: A SaaS onboarding flow asked users two questions after signup: "Did anything confuse you in the setup process?" and "Rate the clarity of each step." Responses revealed that step three (integrating their existing data) created the most cognitive strain. The team hadn't realized that the wording around data mapping was using internal jargon. Rewriting it for a general audience reduced setup abandonment by 14%.
Surveys do have limits: they're reactive, not predictive. They tell you what already went wrong, not what will go wrong for new visitors.
Why usability testing reveals hidden barriers
Usability testing puts real people in front of your site and watches them work through a task. You see not just what they do, but where they hesitate, re-read, click wrong buttons, or ask for help.

- A facilitator gives a participant a realistic goal: "You need to find a plan that fits a team of 10 people and costs under $500 per month."
- The participant works through your site aloud, speaking their thoughts.
- The facilitator watches for confusion, hesitation, task abandonment, or workarounds.
Usability testing scales better than people assume. Even five participants per test round surface about 85% of usability problems. Remote testing tools (Maze, UserTesting, Maze) make it affordable; you're not flying in a full lab anymore.
The trade-off: usability tests are moderately expensive and require recruiting. You also get small sample sizes, so findings are illustrative, not statistically rigorous. But the depth often makes up for the lack of scale.
How heatmaps expose where users actually look and click
Heatmaps and session recordings are the instruments of observed behavior. They show where users' eyes linger, which links they click, where they scroll, and where they give up.

A heatmap displays aggregate click/scroll/attention data across hundreds or thousands of visitors. Red zones show high activity; blue zones are ignored. When you see a bright red cluster on a decorative banner instead of your main CTA, it tells you something about layout, contrast, or cognitive hierarchy is off.
A session recording is video playback of an individual user's session. You watch a single visitor click, scroll, pause, back-button, re-read. Session recordings reveal hesitation patterns that heatmaps can't: Why did this person spend 45 seconds staring at the same paragraph? Why did they click the back button twice before completing checkout?
Tools like Hotjar, Contentsquare, and Fullstory capture both. The combination is effective:
- Heatmaps say: "This button gets fewer clicks than expected."
- Session recordings say: "Users skip the button because they don't see it at first scroll" or "They see it but don't trust the wording."
Real optimizations driven by user insights
Theory is useful; examples are better. Here's how insights translate into fixes:
Example 1: Pricing page clarity
An e-commerce brand ran surveys and usability tests on their pricing page. Users said: "I don't know what the difference is between plans." Session recordings showed users toggling the feature table back and forth, scrolling the same section twice.The team added a side-by-side comparison card that highlighted the top three differences between plans at a glance. Cognitive load dropped because visitors didn't have to hold multiple feature sets in working memory. Upgrade rate lifted 8%.
Example 2: Checkout flow
A checkout abandonment survey revealed that users felt pressured by the number of form fields. Usability testing showed participants filling part of the form, then minimizing the browser to check their email for their address.The team broke the checkout into progressive disclosure: show only the essential fields first, then reveal optional ones after. Session recordings afterward showed users completing the flow faster with fewer hesitation pauses. Cart completion rate improved by 11%.
Example 3: Onboarding copy
A project-management SaaS had high signup but low activation. Heatmaps showed users scrolling past the first screen too quickly. Surveys hinted at confusion: "What am I supposed to do first?"The team rewrote the onboarding from internal jargon ("Create a workspace," "Manage collaborators") to user language ("Set up your first project," "Invite teammates"). Session recordings showed fewer abandons during onboarding; activation rate climbed 17%.
Each fix started with a specific insight about why users struggled, not just a guess.
The research process from start to finish
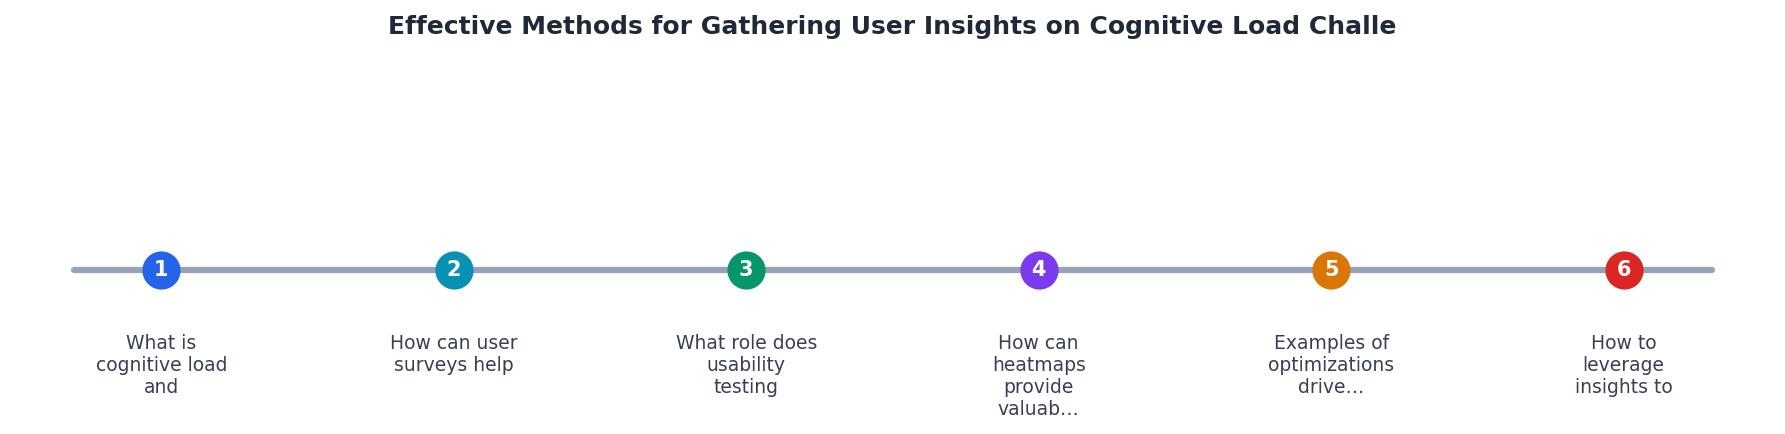
The steps shown in the diagram above outline the core flow: Define, Collect, Analyze, and Act. Here's what each stage involves:
Define: Identify which part of the user journey creates the most drop-off or confusion. Focus your research there first, don't audit everything at once. Are visitors bouncing at the landing page? Abandoning at checkout? Skipping the onboarding? Pick one friction zone.
Collect: Deploy the research method(s) that fit:- Surveys for broad sentiment and patterns (500+ responses).
- Usability tests for deep understanding of why (5–10 participants).
- Heatmaps and recordings for behavioral observation (set-and-forget, continuous).
Analyze: Look for themes. Don't chase single-response outliers. If three out of five usability testers stumbled on the same section, that's a pattern. If 40% of survey responses mention a specific word or phrase, that's a signal.
Act: Prioritize fixes by impact and effort. A wording change to reduce jargon is easy; a layout redesign is not. Start with the high-impact, low-effort changes.
Repeat: Gather insights, implement a change, measure the result, repeat. This is not a one-time audit; it's a cycle.
Leveraging insights to reshape the user journey
User insights aren't just for fixing problems; they're a blueprint for building clarity into every new feature or page you launch.
When insights show that users are confused by choices, you learn to simplify options by default and hide advanced settings behind progressive disclosure. When they reveal that jargon kills comprehension, you build a style guide that locks in plain language. When session recordings show users re-reading the same section, you know the information hierarchy needs work.
The most effective teams don't treat cognitive load as a reactive issue. They make it a design principle. Every new feature asks: How much mental energy does this require? Can we lower it?
"The study of cognitive load in user research revolves around evaluating how much mental effort is required to complete tasks within a digital environment.">, Cognitive Load – Ballpark
This is the heart of it. Your job is not to make things pretty or feature-rich; it's to make them effortless to understand and use. User research is the lens that reveals how far you are from that goal and what to change next.
Key takeaway
Surveys
Capture direct feedback at scale about confusion, clarity, and specific pain points.
Usability Testing
Watch real people work through your site and observe hesitation, confusion, and workarounds.
Heatmaps
See aggregate click, scroll, and attention patterns to identify ignored elements or confusion zones.
Session Recordings
Replay individual user journeys to spot hesitation pauses, re-reading, and task abandonment.
Understanding the cognitive load landscape starts with seeing how each research method works and where it fits. The four techniques above, surveys, usability tests, heatmaps, and session recordings, each give you a different angle on user struggle. Surveys are broad; usability tests are deep. Heatmaps are passive; session recordings are detailed. The most effective research programs use multiple methods in parallel, so you see the full picture of where your audience struggles and what mental effort drains their focus.
Step-by-Step Guide: Conducting User Research for Cognitive Load Insights
Your progress is saved automatically in your browser.
FAQ
Frequently Asked Questions
Additional Resources
- Cognitive Load Measurement Methods for Usability Testing - The most frequently used methods were performance measures (19%), NASA-TLX (12%), and eye fixations (11%) relative merits of cognitive load ...
- Cognitive Load - One of the most effective ways to reduce cognitive load is by simplifying the visual design. Removing unnecessary elements, such as excessive text, images ...
- What is Cognitive Load, and why does it matter? - How can we measure cognitive workload in a way that's both accurate and non-invasive? One reliable method is pupil dilation: the automatic widening of pupils ...