
Every dollar you spend on paid traffic lands visitors on a page that might confuse them into leaving. Cognitive accessibility improvements reduce that confusion, but most business owners never measure whether those changes actually pay for themselves. This article gives you a concrete framework for tracking the financial return of cognitive accessibility work, from baseline metrics through attribution to a final dollar figure you can put in a board deck.

- Measuring the ROI of cognitive accessibility means connecting specific UX changes (simplified copy, clearer navigation, reduced cognitive load) to revenue metrics like conversion rate, bounce rate, and customer acquisition cost.
- Companies that track these metrics before and after accessibility improvements consistently see measurable financial gains, often in the range of 10-30% conversion lifts on affected pages.
- Compliance benefits add a second ROI layer: reduced legal risk, broader market reach, and eligibility for government contracts.
Why ROI matters for accessibility
Accessibility conversations often stall at "it's the right thing to do." That statement is true, but it does not unlock budget. Budget comes from projected returns. If you run a SaaS product or DTC brand and you are spending real money on acquisition, you need to know whether simplifying your checkout flow or rewriting your pricing page in plain language actually moves the revenue needle.
Cognitive accessibility refers to design and content choices that reduce the mental effort required to understand and use a website. This includes plain language, predictable navigation, clear visual hierarchy, and reduced decision fatigue. Unlike technical accessibility (alt text, color contrast, keyboard navigation), cognitive accessibility targets comprehension. It helps people with ADHD, dyslexia, anxiety, low digital literacy, and honestly, everyone who is tired, distracted, or in a hurry.
The ROI question is straightforward: did the money and time spent on cognitive accessibility improvements generate more revenue (or save more cost) than they consumed?
That number is not hypothetical. A significant portion of any audience faces cognitive barriers on poorly designed pages. When those visitors leave, you lose revenue you already paid to acquire.
How cognitive load affects conversions

Cognitive load is the total amount of mental effort a visitor uses to process your page. When cognitive load exceeds a visitor's capacity, they do one of three things: leave, make errors, or freeze. All three kill conversions.
Here is what high cognitive load looks like in analytics:
- High bounce rate on key pages where the content is dense or the layout is cluttered
- Form abandonment at steps that require too many decisions at once
- Low scroll depth on pages where the value proposition is buried below jargon
- Repeated visits without conversion, suggesting the visitor could not figure out the next step
When e-commerce sites simplify their checkout flows by removing unnecessary form fields, using progress indicators, and writing clearer error messages, cart abandonment drops. That drop translates directly to recovered revenue.
Key metrics to track

You cannot calculate ROI without the right inputs. Here are the metrics that connect cognitive accessibility changes to financial outcomes:
Conversion-related metrics
- Conversion rate (primary): The percentage of visitors who complete your target action. Measure this per page and per funnel step, not just site-wide.
- Bounce rate: The percentage of single-page sessions. A drop in bounce rate after accessibility changes indicates visitors are engaging more.
- Task completion rate: For SaaS products, track whether users complete onboarding steps, feature activation, or upgrade flows.
- Time on task: How long it takes a visitor to complete a specific action. Shorter is usually better for transactional pages; longer can be better for educational content.
- Error rate: How often users make mistakes in forms, search queries, or navigation. Cognitive accessibility improvements should reduce errors.
Revenue metrics
- Revenue per visitor (RPV): Total revenue divided by total visitors. This is the single best metric for ROI calculation because it captures both conversion rate and average order value.
- Customer acquisition cost (CAC): If the same ad spend produces more conversions after accessibility improvements, your CAC drops.
- Lifetime value (LTV): Customers who had a clear, low-friction first experience tend to retain better. Track cohort LTV before and after changes.
Engagement metrics
- Scroll depth: Are visitors reaching your call-to-action?
- Click-through rate on CTAs: Are visitors understanding what to do next?
- Support ticket volume: A drop in "how do I..." tickets after a redesign signals improved comprehension.
The following interactive dashboard shows an example of how these metrics connect for a typical SaaS landing page before and after cognitive accessibility improvements.
Example: SaaS Landing Page ROI Dashboard
Financial benefits from real companies
Concrete numbers make the case better than theory. Here are patterns observed across industries when companies invest in cognitive accessibility:
E-commerce: simplified product pages
A mid-size online retailer restructured its product pages by replacing walls of specification text with scannable bullet points, adding clear size guides with visual references, and simplifying the "Add to Cart" flow from three clicks to one. The results over 90 days:
- Conversion rate increased from 3.2% to 4.1% (a 28% lift)
- Return rate dropped by 12% because customers understood what they were buying
- Support tickets related to product questions fell by 35%
SaaS: rewritten onboarding flows
A B2B SaaS company rewrote its onboarding sequence using plain language principles. They replaced technical jargon with task-oriented instructions, added progress indicators, and broke a 12-step setup into three logical phases. Trial-to-paid conversion improved by 18%, which at their price point represented over $400,000 in additional annual recurring revenue.
Financial services: plain language forms
A regional bank redesigned its online loan application using cognitive accessibility principles: shorter sentences, one question per screen, inline help text, and a progress bar. Application completion rates jumped from 34% to 57%. Each completed application had an average loan value of $12,000, so the revenue impact was substantial.
"The accessibility problems of today are the mainstream breakthroughs of tomorrow.Eve Andersson, Director, Accessibility Engineering, Google.">, Metrics to measure the ROI of web accessibility
How compliance affects the bottom line

Compliance is not just a cost center. It has direct financial implications that belong in your ROI calculation:
- Legal risk reduction: ADA-related web accessibility lawsuits in the US have increased year over year. The average settlement cost ranges from $5,000 to $100,000+, not counting legal fees. Proactive accessibility work is cheaper than reactive litigation.
- Market expansion: Approximately 15-20% of the global population has some form of disability. Cognitive disabilities are the largest category. An accessible site reaches more paying customers.
- Government and enterprise contracts: Many public sector RFPs require accessibility compliance. Meeting standards like WCAG 2.2 and the European Accessibility Act (EAA) opens doors to contracts that competitors cannot bid on.
- SEO benefits: Cognitive accessibility improvements (clear headings, structured content, descriptive link text, plain language) align directly with search engine ranking factors. Better accessibility often means better organic traffic at zero additional acquisition cost.
| Reactive Approach | Proactive Accessibility |
|---|---|
| Fix issues after lawsuits | Prevent issues before they arise |
| $50K-$150K per lawsuit | $5K-$30K for comprehensive audit + fixes |
| Reputation damage | Brand trust and loyalty |
| Narrow audience reach | 15-20% larger addressable market |
| No SEO benefit | Improved organic rankings |
| One-time patch | Sustainable design system |
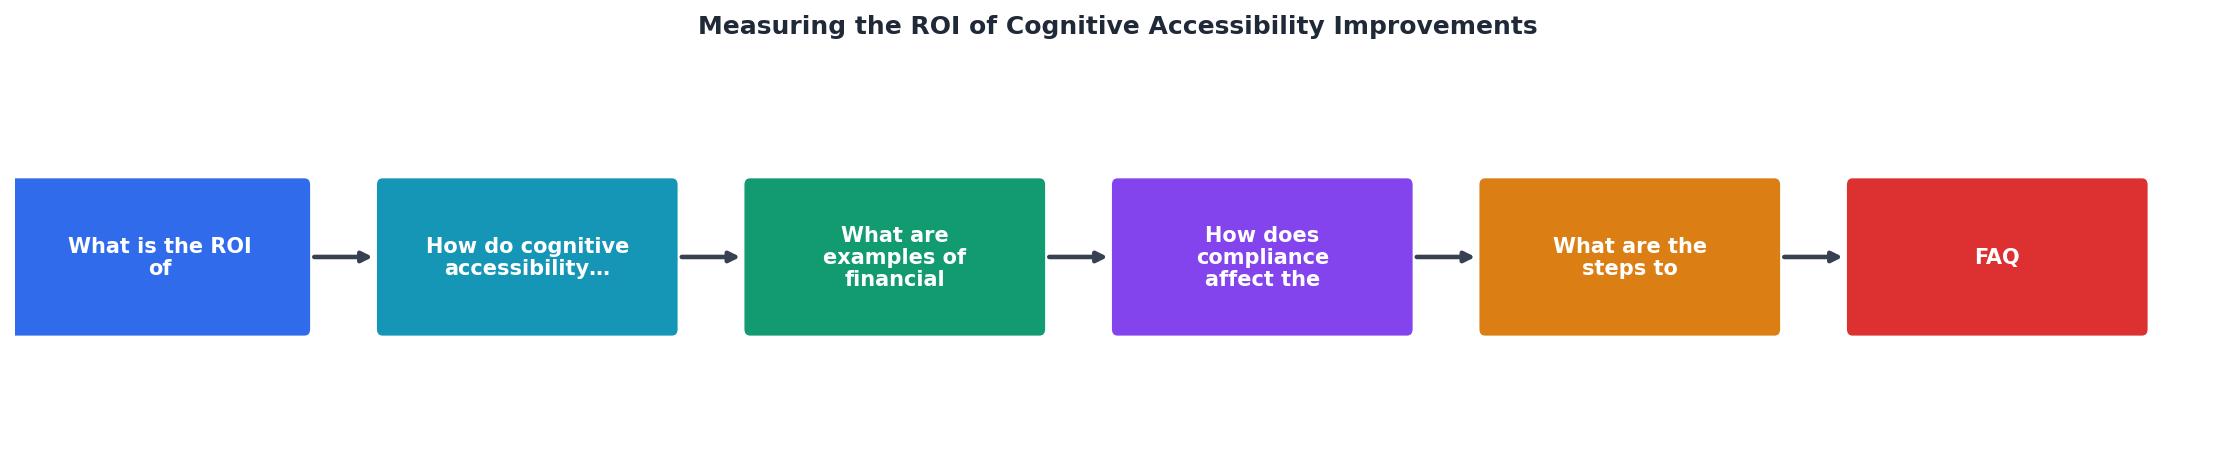
Steps to measure ROI effectively
This is where the work happens. Follow this process to build a repeatable ROI measurement framework for cognitive accessibility improvements.
Step 1: Establish baselines
Before changing anything, record your current metrics on the pages you plan to improve. You need at least 30 days of data (ideally 60-90) to account for seasonal variation. Capture:
- Conversion rate per page
- Bounce rate per page
- Revenue per visitor
- Task completion rate (if applicable)
- Support ticket volume related to confusion or usability
Step 2: Identify cognitive barriers
Audit your target pages for cognitive accessibility issues. Look for:
- Dense text blocks without visual breaks
- Jargon or technical language that your audience may not understand
- Unclear calls to action (vague button labels like "Submit" or "Continue")
- Too many choices presented simultaneously
- Missing feedback (no confirmation after actions, no progress indicators)
- Inconsistent navigation patterns across pages
Step 3: Prioritize by impact
Not all pages deserve equal attention. Rank your pages by a simple formula:
Priority Score = Monthly Traffic x Current Conversion Rate Gap x Revenue per Conversion
The "Conversion Rate Gap" is the difference between your current rate and a reasonable target (industry benchmarks or your best-performing similar page). Focus on pages where the gap is large and the traffic is high.
Step 4: Implement changes
Make cognitive accessibility improvements to your prioritized pages. Keep changes documented so you can attribute results accurately. Common high-impact changes include:
- Rewriting headlines and body copy at a lower reading level
- Breaking long forms into multi-step flows
- Adding visual hierarchy (headings, whitespace, bullet points)
- Simplifying navigation menus
- Adding inline help text and tooltips
- Using descriptive button labels ("Start Free Trial" instead of "Submit")
Step 5: Measure and compare
After implementation, wait for the same duration as your baseline period (minimum 30 days). Compare the same metrics. Calculate the financial impact:
ROI = (Revenue Gain - Investment Cost) / Investment Cost x 100
For example: if you spent $10,000 on improvements and generated $40,000 in additional revenue over the measurement period, your ROI is 300%.
Step 6: Document and iterate
Create a report that connects specific changes to specific metric movements. This documentation serves two purposes: it justifies future accessibility investment, and it builds institutional knowledge about what works for your audience.
ROI measurement checklist
Use this checklist to ensure you cover every step when measuring the return on cognitive accessibility work.
Cognitive Accessibility ROI Measurement Checklist
Your progress is saved automatically in your browser.
FAQ
Frequently Asked Questions
Additional Resources
- Measuring Accessibility ROI: Breaking the Cycle - If you don't measure ROI, you can't prove accessibility works. The accessibility ROI loop is simple: 1. You understand the benefits of ...
- Metrics to measure the ROI of web accessibility - Every dollar invested into web accessibility and user experience improvements brings back $100, which gives a return on investment, or ROI, of 99%.
- Accessibility ROI: KPIs That Prove the Business Impact - The Core KPIs that Measure Accessibility ROI · 1. Number of Accessibility Errors · 2. Conversion Rate Improvements · 3. Audience Reach · 4. Legal ...