

Dashboard pages are often where users make their most important decisions. Yet most dashboards fail cognitive accessibility: they overload visitors with competing data, unclear hierarchy, and confusing navigation. The result is lost conversions, frustrated users, and wasted marketing spend. This guide gives you a concrete framework to identify and fix the cognitive barriers holding your dashboard back, starting today.
TL;DR
- Dashboard cognitive accessibility starts with information hierarchy: eliminate redundant data, highlight the action that matters most, and remove visual noise.
- Speed of comprehension is your metric: users should understand the page purpose and next step within seconds, not minutes.
- Test with real visitors (especially those with ADHD, anxiety, or low digital literacy) to find where confusion happens, analytics alone won't tell you.
- Common fixes: clearer headings, simpler forms, progressive disclosure (show advanced options on demand), and stronger visual separation between sections.
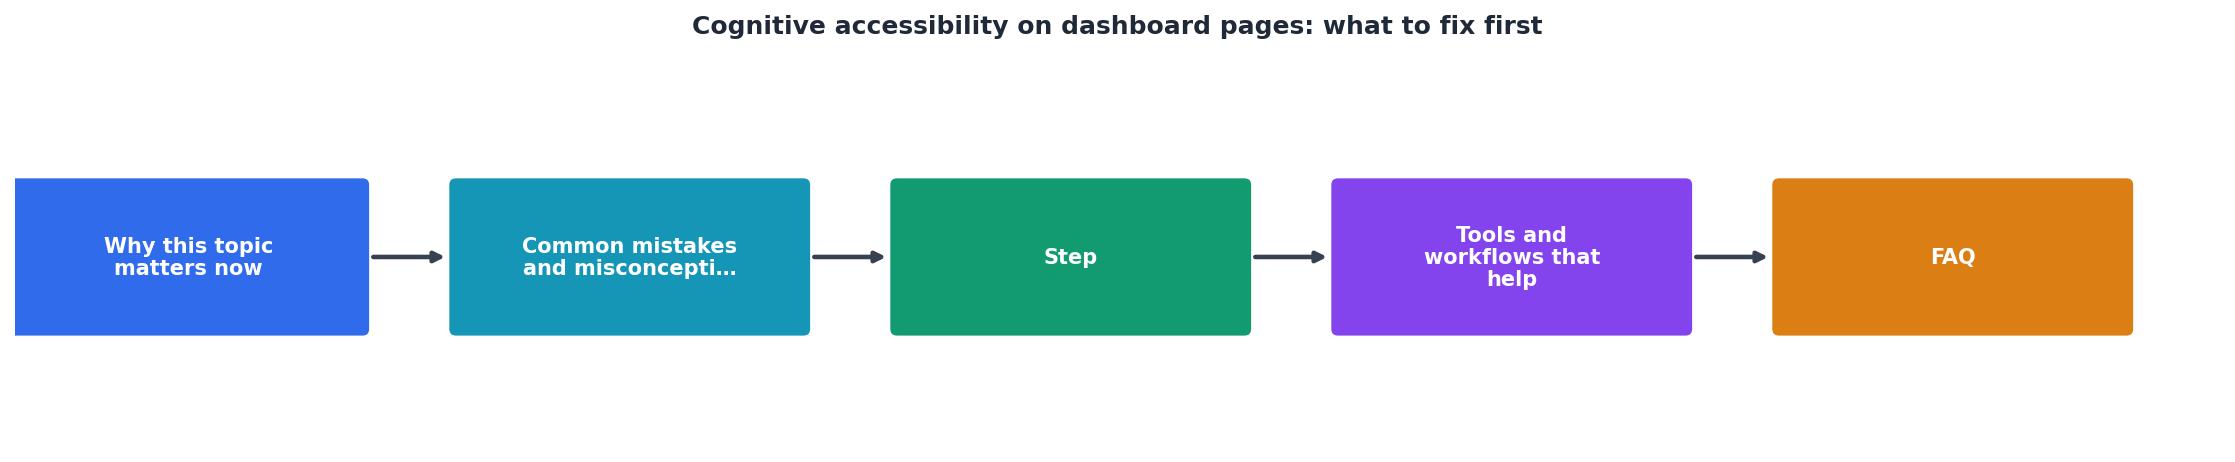
- Accessibility is a pipeline: audit → prioritize → fix → measure → repeat.
Why this matters now
Dashboard pages are conversion killers when they don't respect cognitive limits. A typical dashboard asks users to parse multiple data sets, navigate nested menus, and make decisions without clear context. For visitors with ADHD, anxiety, dyslexia, or simply working on a phone at 3 AM, the experience breaks.
The cost is real: confused visitors bounce, abandon carts, or never sign up. Every second spent decoding your dashboard is a second the user isn't converting. And unlike a slow server, cognitive friction is invisible in standard analytics, you see the drop-off but not the reason.
Cognitive accessibility isn't a compliance checkbox. It's a business lever. Sites that reduce cognitive load see higher conversion rates, longer session times, and lower support tickets. Dashboards that work for people with cognitive disabilities work better for everyone.
Common mistakes and misconceptions
Mistake 1: Assuming "more data" helps
Teams pack dashboards with metrics, charts, and filters because "users might want it." The opposite is true. Every extra element increases cognitive load. A visitor landing on your dashboard should see one clear message: what is this for, and what do I do next?
Mistake 2: Treating accessibility as a design afterthought
Many teams audit accessibility after shipping. At that stage, fixing cognitive barriers means redesign, expensive and disruptive. Build accessibility into your process from the start: prototype with real users early, test with people who have cognitive disabilities, iterate.
Mistake 3: Confusing visual accessibility with cognitive accessibility
Passing WCAG color contrast checks does not mean your dashboard is cognitively accessible. You can have perfect alt-text, keyboard navigation, and screen-reader support and still have a confusing information hierarchy that overwhelms users.
Mistake 4: Ignoring progressive disclosure
Dashboards often show all options at once. Buttons, filters, advanced settings, all visible, all competing for attention. Progressive disclosure (hiding complexity behind "show more" or secondary UI) is cognitive accessibility 101. Show the default path; let power users find the levers.
Step-by-step approach
1. Audit your current state

Walk through your dashboard as a first-time visitor. Ask yourself:
- Can I name the purpose of this page in one sentence?
- What is the primary action I should take?
- How many steps does it take to complete that action?
- Are there elements I don't recognize or that distract from the main task?
2. Map the information hierarchy

Not all information is equal. Decide:
- What does the user need to see first? (The big number? The status? The action button?)
- What can they discover on demand? (Advanced filters, historical data, settings.)
- What is truly irrelevant? (Delete it.)
3. Simplify navigation and actions
Dashboards often bury the key action. If a user has to hunt for the "convert," "purchase," or "next step" button, you've failed. That button should be visually obvious within the first screen, not requiring scroll, not hidden in a menu.
For navigation between sections, use breadcrumbs or clear section labels. Avoid nested dropdowns; they're hard to navigate for people with motor control issues and frustrating for anyone on mobile.
4. Test with real users

Recruit users with ADHD, anxiety, dyslexia, or low digital literacy. Watch them use your dashboard cold, no briefing, no tour. Where do they hesitate? What do they miss? Which text do they reread?
This is where the rubber meets the road. Your team thinks the dashboard is clear. Real users reveal the blind spots.
"Practical rule: If users need to reread a paragraph several times to find one action, the experience may pass technical checks and still fail accessibility review.">, Cognitive Disabilities Examples: Design Accessible Web
5. Implement and measure
Changes to cognitive accessibility aren't always reflected in standard analytics. Track:
- Time to first interaction: How long before the user clicks, scrolls, or engages?
- Bounce rate on dashboard: Did the page clarify or confuse?
- Completion rate: What percent finish the primary action?
- Return rate: Do users come back, or does the confusion stick?
Tools and workflows that help
Audit tools
PagePerson Insights (Chrome extension) analyzes your dashboard for cognitive barriers, unclear hierarchy, information overload, confusing form patterns. It surfaces exactly where real visitors struggle.
WAVE and Axe DevTools check technical accessibility (WCAG). They won't catch cognitive issues, but they're your baseline for contrast, headings structure, and semantic markup.
Heat mapping (Hotjar, Crazy Egg) shows where users look and click. If users aren't finding the main call-to-action, heatmaps prove it.
Design workflows
- Card sort: Show users your dashboard elements. Ask them to group by purpose. Mismatch between your grouping and theirs signals cognitive friction.
- Five-second test: Show your dashboard for five seconds, then hide it. Can the user recall the primary purpose and action? If not, it's not clear enough.
- Think-aloud protocol: Have a user narrate their thoughts as they explore. Listen for confusion, uncertainty, and reinterpretation.
Metrics to track
Keep a spreadsheet of friction points: unclear heading, missing context, hidden action, redundant data. Prioritize by impact (how many users hit it) and difficulty (how hard to fix). This becomes your roadmap.
Interactive cognitive load assessment
To visualize how cognitive barriers compound, here's an example dashboard audit:
Example: Cognitive Load Audit
This example shows a typical dashboard struggling with five major cognitive barriers. Fixing even half of these would significantly improve user comprehension and conversion. The audit is your first step; measurement comes after you implement fixes.
Practical artifact: Cognitive accessibility audit checklist
Use this checklist to audit your own dashboard. Check off each item as you verify it; red flags point to immediate fixes.
Dashboard Cognitive Accessibility Audit
Your progress is saved automatically in your browser.
FAQ
Frequently Asked Questions
Additional Resources
- Cognitive Disabilities Examples: Design Accessible Web - What to fix first ... Start in high-risk flows: pricing, signup, checkout, account recovery, benefits enrollment, claims, and support content. Those are the pages ...
- Designing user interfaces for content simplification aimed at ... - Cognitive accessibility aims to make content more accessible for people with cognitive impairments, such as the elderly and people with intellectual and ...
- Build Dashboards for Accessibility - Format for accessibility at the dashboard and workbook level. Aggregate and reduce marks. Eliminate redundant information. Use color and shape to differentiate ...