

Photo by Julio Lopez from Pexels
Your dashboard is supposed to give visitors answers. Instead, it's drowning them in options. When visitors land on a dashboard, whether it's your SaaS onboarding, an analytics interface, or a settings panel, they have a finite amount of mental fuel. The moment you exceed their working memory capacity, they check out, scroll away, or bounce to a competitor who makes it simpler.
TL;DR:- Working memory holds only 3-5 distinct items simultaneously; dashboards that exceed this capacity cause cognitive overload and higher bounce rates.
- Effective dashboard layouts group related information, minimize decision points, and use clear visual hierarchy to guide focus sequentially.
- Progressive disclosure, chunking, and spatial clustering reduce cognitive load and improve both comprehension and conversion.
Why working memory matters now
Forty-two percent of website visitors struggle with cognitive accessibility, meaning they can't easily process information on your site. That's not a small edge case. It's nearly half your traffic. And dashboards are the worst offenders because they pack dense information into a limited space.
Working memory is the mental workspace where you hold and manipulate information right now. It's not long-term storage. It's the sticky note on your desk. You can comfortably keep about three to five distinct ideas in working memory at once. A phone number, a short list, a concept you're thinking through. Add a sixth, and something falls off.
When designers cram ten widgets, four navigation layers, and six color-coded data streams into a dashboard, they're not just creating visual clutter. They're forcing visitors to juggle more than their working memory can hold. The result: decision paralysis, task abandonment, and a higher bounce rate.
"Healthcare systems implementing new analytics platforms typically see 40 to 60% adoption rates within the first year, not resistance to change, but neurological self-protection.">, Medium
This isn't about preference. It's neurology. When cognitive load exceeds working memory, visitors disengage automatically.
Common mistakes in dashboard design

Most dashboard failures come from the same few patterns:
Too many metrics at once. A dashboard that shows 12 KPIs simultaneously expects visitors to synthesize all of them. They can't. They grab one or two numbers, assume they're the relevant ones, and make decisions based on incomplete data. Then they're confused why the results don't match expectations.
No visual hierarchy. When every metric gets the same size, color, and weight, there's no guide for where to look first. Visitors create their own hierarchy by accident, usually wrong. They fixate on the flashy number instead of the actionable one.
Mixed purposes in one view. Combining real-time alerts, historical trends, user guides, and action buttons in a single dashboard forces visitors to context-switch constantly. Each switch consumes working memory. After three or four switches, they've exhausted their mental budget.
Buried actions. When the thing you want visitors to do, sign up, purchase, submit, is hidden below the fold or nested in a dropdown, it increases the cognitive steps required to take action. That friction converts to abandonment.
Inconsistent patterns. If your navigation works one way in the dashboard and differently in the modal, if your data tables use different sorting logic, or if your buttons look different based on context, visitors have to relearn the interface every time. That cognitive cost adds up.
Build clarity through information architecture

Working memory is a bottleneck. You can't increase its capacity. You can only work within it.
Start by defining the primary task for your dashboard. Not all the tasks. The primary one. For a freelancer's dashboard, it's "see what I earned this month." For a marketer's analytics, it's "understand campaign performance." For a SaaS user, it's "check if everything is running." That single primary task should occupy the top 60% of visual real estate.
Then organize supporting information into no more than three to four secondary zones. Salesforce dashboards often fail here, they let users pile unlimited widgets. The successful ones enforce limits. Mixpanel's dashboards succeed by giving you a main graph, three to four supplementary metrics, and filters. That's it. You're never wondering what to look at first.
Use spatial clustering. Put related items near each other. If your dashboard shows revenue, cost, and profit, don't scatter them across corners. Group them in one card. That clusters them in working memory too. When someone thinks about revenue, they automatically pull cost and profit into the same mental frame.
Apply progressive disclosure. Show only what's necessary to make the next decision. If a visitor needs to choose a date range before seeing data, show the date picker first, then reveal the data. Sequencing reduces simultaneous cognitive load.
Eliminate redundancy. If you're showing the same data in two formats (a table and a chart), pick one. If you're repeating navigation elements in multiple places, consolidate. Every redundant element competes for attention and working memory space.
Step-by-step approach to layout redesign
Start by auditing your current dashboard. Open it. Spend five minutes using it as a new visitor would. Don't navigate to the help docs. Just click around. What catches your eye first? What confuses you? Where do you get lost? Those friction points are where working memory is overloading.
Count the number of distinct visual elements above the fold: buttons, cards, metrics, labels, icons, color blocks. If it's more than eight, you have too many. If it's more than twelve, your dashboard is functionally unusable for anyone whose cognitive load is elevated (tired, distracted, anxious, or neurodivergent).
Step 1: Identify the primary action. What does a first-time visitor need to do? Not what can they do. What should they do? Make that path impossible to miss. Visual weight should follow priority. If the goal is conversion, the call-to-action should dominate the layout.
Step 2: Group related information. Use the F-pattern or Z-pattern (left-to-right, top-to-bottom reading flow) to structure information. Visitors scan dashboards in predictable patterns. Align your layout with that pattern.
Step 3: Reduce color count. More than three colors competing for attention creates visual noise that fragments focus. Pick one highlight color, use neutral backgrounds, and reserve color for high-priority alerts only.
Step 4: Simplify typography. One typeface, maximum two sizes. Every variation in font fights for processing power. Consistency is cognitive relief.
Step 5: Test with actual users. Watch someone unfamiliar with your dashboard use it. Ask them to think aloud. "What are you looking for?" "What would you click next?" Their hesitations reveal working memory bottlenecks you can't see from the inside.
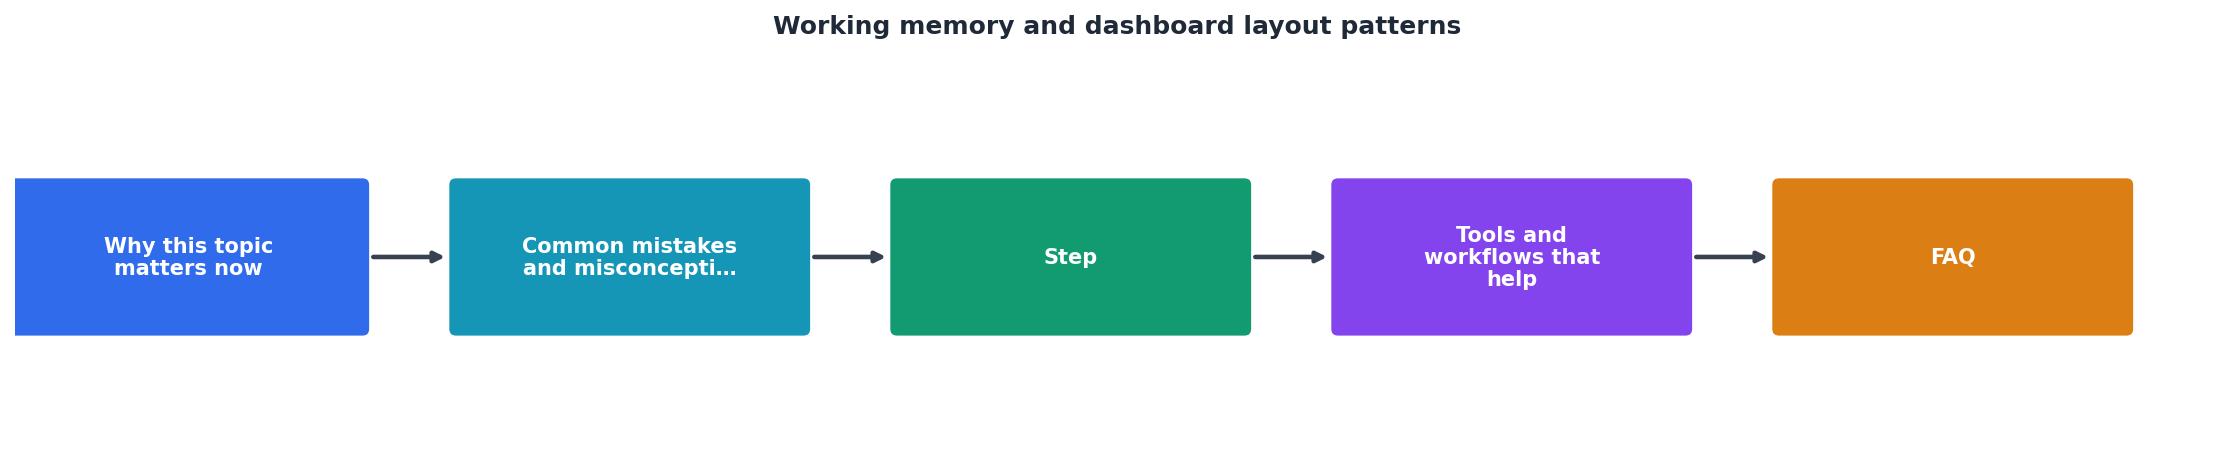
Tools and workflows that help

Design tools help, but they're not the bottleneck. Figma, Adobe XD, and Sketch all support responsive dashboard layouts. Use component libraries to enforce consistency. Create reusable card patterns, button states, and input styles. Consistency reduces cognitive load because visitors don't have to relearn visual language.
For testing, heatmap tools show where visitors look. But they don't explain why. Session recordings show behavior, but you need to watch for moments where they hesitate, re-read, or scroll back up. Those are working memory failures. Tools like Hotjar, Clarity, and Fullstory capture those moments.
But the most valuable tool is user testing. Set up a simple script: "Navigate to [your dashboard]. Find [specific task]. Tell me what you're thinking as you do it." Record it. Watch. You'll see instantly where working memory overloads. They'll go silent, their eyes will dart around, or they'll ask "where is..." multiple times. That's the signal to redesign.
Use a cognitive load assessment. Before you ship a redesign, ask: Can I describe the primary action in one sentence? Can I identify it in the layout within two seconds? Are there more than four distinct "zones" competing for attention? If you answer no, maybe, or yes, redesign.
Quick Dashboard Health Check
This quick health check surfaces the most common issues. If you're failing checks 1 or 2, your layout is competing with itself. If you're failing 3 or 4, you're adding unnecessary cognitive friction.
Dashboard Redesign Checklist
Your progress is saved automatically in your browser.
FAQ
Frequently Asked Questions
The difference between a dashboard that converts and one that leaks visitors is working memory. You can't increase human capacity. You can only design within it. Strip away the noise, group related information, guide attention with hierarchy, and respect the fact that your visitors are thinking humans with finite mental fuel. The ones who do this get the conversion lift. The ones who don't keep wondering why users bounce.
Additional Resources
- How are patterned movements stored in working memory? - The results of Experiment 1 indicated that individuals can store 3–4 patterned movements in working memory; however, a change in stimulus format or an increase ...
- The Cognitive Cost of Dashboard Design - Browser - Effective dashboards leverage System 1 processing, delivering immediate “aha moments” through visual patterns that the brain recognises ...
- Dashboard UI Design: 3 Principles for Reducing Cognitive ... - Learn how to design effective dashboard UIs by mastering information hierarchy, white space, cognitive load, color, typography, and layout. Good dashboard UI ...