

Your visitors land on your site, scroll for a few seconds, and leave. Your analytics show the drop-off, but not the reason. You've tested headlines, tweaked colors, and optimized load speed, yet conversion still stalls. The missing piece isn't usually bad design or poor copy. It's cognitive friction: the invisible mental load that makes your site harder to understand than it needs to be.

- Cognitive friction, the mental effort needed to understand and act on your site, is a silent conversion killer that standard analytics miss.
- Common sources include unclear value propositions, jargon-heavy copy, cluttered layouts, and confusing navigation paths.
- Reducing cognitive load requires auditing real visitor struggles, simplifying decision trees, and testing comprehension before polish.
- Tools like visitor session recordings and cognitive accessibility audits reveal where visitors get stuck, so you can fix the right things first.
Why cognitive friction matters for your bottom line
Your paid traffic is expensive. A 5% improvement in conversion rate from that same traffic is free growth. But you can't fix what you can't see. Heat maps show you where visitors click; session recordings show what they do; but neither shows you what confused them, why they hesitated, or which mental barrier made them leave.
Cognitive friction is the sum of small frictions: unclear next steps, too many choices at once, jargon that assumes knowledge the visitor doesn't have, copy that buries the core benefit, or layouts that make scanning hard. Individually, each one is a small speed bump. Together, they add up to a visit that feels effortful rather than rewarding.
The impact is real. When visitors expend mental energy just to understand what you offer, they have less energy left for conversion. They're more likely to bounce. They're more likely to choose a competitor who made it simpler. And they're far less likely to become advocates, because they didn't experience clarity, they experienced friction.
Common sources of cognitive friction
Before you can fix cognitive load, you need to spot it. These are the patterns that most often trip up visitors.
Unclear value proposition. You know what your product does. Your team has debated the positioning for weeks. But a first-time visitor should grasp the core benefit in seconds, not sentences. If someone reads your headline and still doesn't know what problem you solve or who you're for, you have a friction point.
Jargon and assumed knowledge. Technical terms, industry acronyms, or insider language all require the visitor to translate. They can do it, but it costs mental effort. A visitor with ADHD or anxiety, or someone in a hurry, will often bounce rather than decode.
Too many choices or calls to action. Decision paralysis is real. If your homepage offers five different entry points, users don't feel empowered, they feel stuck. Each additional choice adds cognitive load.
Cluttered layouts and poor visual hierarchy. When everything on a page looks equally important, nothing stands out. Visitors have to spend mental energy figuring out where to focus. A clean layout with clear visual hierarchy makes next steps obvious.
Confusing navigation structure. If the path to conversion (or to the information they seek) feels random or unintuitive, visitors waste cycles trying to find what they're looking for. Dead ends and backtracking add frustration and friction.

How to audit and reduce cognitive friction
The first step is to see your site through a visitor's eyes, not your team's eyes. You built it; you know how it works. A stranger doesn't.
Run session recordings with fresh visitors. Tools like Hotjar, FullStory, or Glassbox show you where visitors hesitate, re-read, or backtrack. Watch for moments where they move the mouse without clicking (searching for a button), or where they pause for several seconds (reading and re-reading copy). These moments reveal friction.
Ask visitors directly about comprehension. A simple post-visit survey with one or two questions, "Was the value of our product clear?" or "Did you know what to do next?", surfaces confusion quantitatively. Combine this with open feedback to pinpoint where.
Test with people outside your bubble. Ask a friend who's not in your industry to spend two minutes on your site and tell you what you do. If they can't answer, neither will most visitors. Repeat with three or four people; patterns will emerge.
Simplify your value proposition. Write a one-sentence description of what you do and who it's for. If you can't, your positioning isn't clear enough. Once you have that, ensure it appears prominently, ideally in the headline or first two lines of copy.
Remove jargon. Read your copy aloud as if explaining to someone with no domain knowledge. Replace technical terms with plain language. If a term is necessary, define it inline: "our attribution model (the system that tracks which touchpoint drove each conversion)" reads easier than jargon alone.
Reduce choices on key pages. On a landing page or checkout step, limit call-to-action buttons to one primary action and one secondary option. Anything more is clutter.
Use white space and contrast. A clean layout with breathing room makes it easier for eyes, and brains, to focus. High contrast between elements helps visitors see where to look next.

Step-by-step process for fixing cognitive barriers
Identify, prioritize, and fix friction systematically. This process works whether you're optimizing a landing page or an entire flow.
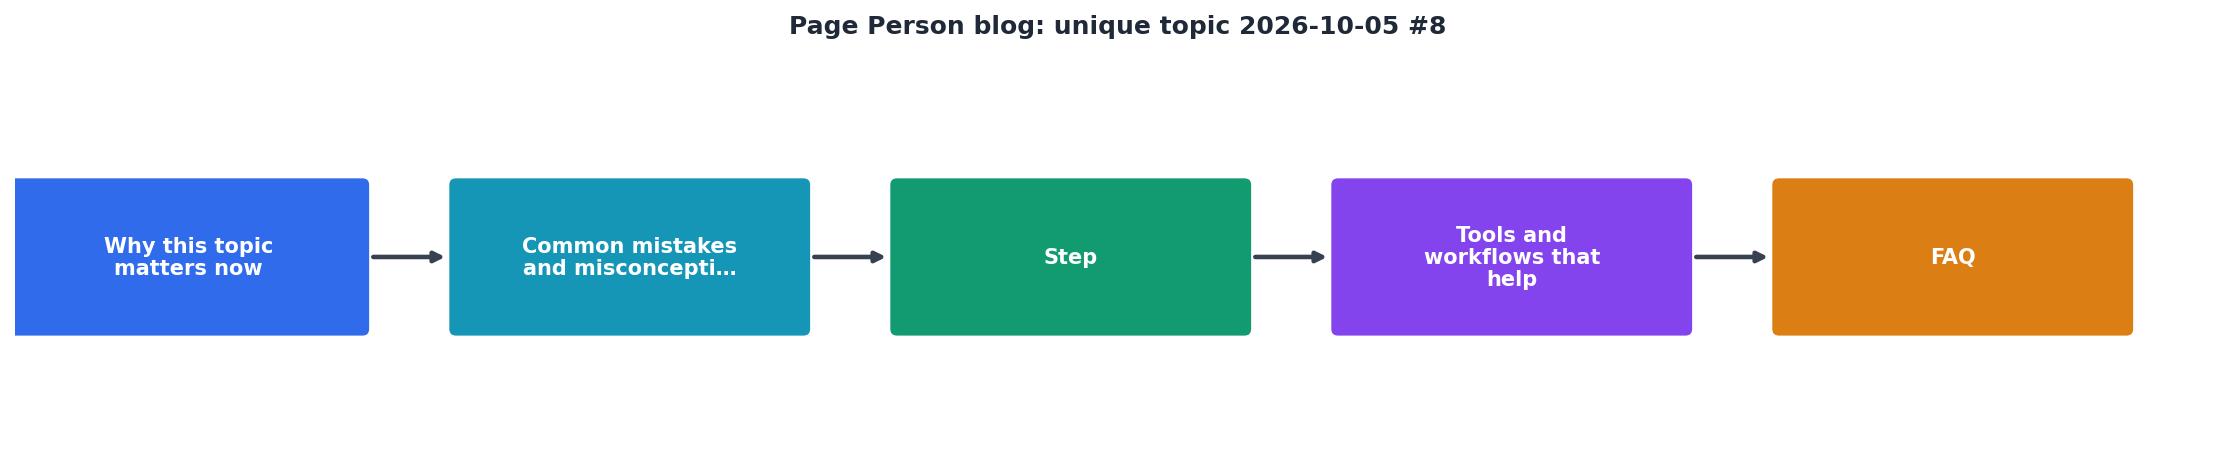
Step 1: Map the visitor journey. Write down every step a visitor takes from landing to conversion (sign-up, purchase, etc.). Include every page, form field, and decision point. This is your friction audit baseline.
Step 2: Identify high-friction moments. Use session data, support tickets, and user testing to flag steps where visitors hesitate, get stuck, or drop off. Prioritize by conversion impact, a friction point that kills 10% of your traffic matters more than one that kills 1%.
Step 3: Reduce cognitive load at each step. Simplify copy, remove jargon, clarify next steps, remove unnecessary form fields, and tighten visual hierarchy. Make each step feel obvious, not clever.
Step 4: Test and measure. Retest comprehension with new visitors. Measure conversion rate before and after. A small drop in traffic volume but higher conversion rate is often a win.
Step 5: Iterate. Cognitive friction isn't a one-time fix. As you grow and add features, new friction points emerge. Make this a regular audit.
"The personal growth blogs below have been a huge source of inspiration to me as I have worked to grow my own online community – and grow myself personally.">, 13 Personal Growth Blogs That Can Change Your Life, Profound Impact
Tools and workflows that help
You don't need expensive consultants to spot cognitive friction. A few focused tools get you there.
Session recording tools: Hotjar, FullStory, Glassbox, or LogRocket let you watch how visitors actually interact with your site. You'll spot hesitations, scrolling patterns, and dead ends that analytics alone won't show.
A/B testing platforms: Optimizely, VWO, or Convert let you test clearer copy, simpler layouts, and simplified flows. Measure comprehension directly by asking visitors post-session or by tracking downstream conversion.
Accessibility audit tools: Tools like Page Person (the PagePerson Insights Chrome extension) audit cognitive accessibility specifically, flagging unclear value props, jargon density, visual hierarchy issues, and form complexity all at once. This saves hours of manual review.
Customer feedback: Surveys, support chat logs, and feature requests all contain hints about where visitors got confused. If three people ask "what exactly does this do?", you have a clarity problem.
Internal testing: Before you launch, have someone outside the core team spend 10 minutes on your page with the task "figure out what we do and what to do next." Their struggle points are your friction points.
The workflow: Record sessions → Spot hesitations → Survey for clarity → Test clearer version → Measure lift → Repeat. Simple, fast, and it works.
Typical Friction Audit Results
This dashboard shows what a typical site audit reveals before optimization work starts. Actual numbers vary by industry and audience, but these patterns are common. The good news: fixing just one or two of these friction points often lifts conversion by 1-3%.
Actionable checklist for your next audit
Use this checklist to run your own cognitive friction audit. It takes 30-60 minutes and requires no tools beyond a browser and a note-taking app.
Cognitive Friction Audit Checklist
Your progress is saved automatically in your browser.
FAQ
Frequently Asked Questions
The opportunity is clear: your visitors are already coming. The question is whether they understand what you offer and feel confident enough to convert. Reduce cognitive friction, and you turn wasted traffic into growth, without spending on paid acquisition or overhauling your design. Start small, measure everything, and iterate. The friction you remove today compounds into growth you'll see for months.
Additional Resources
- 13 Personal Growth Blogs That Can Change Your Life - The personal growth blogs below have been a huge source of inspiration to me as I have worked to grow my own online community – and grow myself personally. I ...
- Best Niches & Trending Topics to Start a Blog in 2026 - Find out what to blog about in 2026—top niches, trending topics, and money-making ideas to help you grow and profit from your blog.
- 10 Best Blog Ideas for 2026 That People Actually Read - 1. “What I Wish I Knew Before…” Posts · 2. Opinion Posts That Explain the Reasoning · 3. Behind-the-Scenes Reality Posts · 4. Step-by-Step How-To ...