
You spent real money driving traffic to your site. Some of those visitors land, stare at your page for eight seconds, and leave without clicking a single button. Not because your product is bad, but because your page confused them. Cognitive accessibility fixes address exactly that gap, yet most founders never measure whether those fixes actually paid off. This article gives you a concrete framework to calculate the return on every cognitive accessibility dollar you invest.

- Cognitive accessibility improvements directly reduce bounce rates and increase conversions from existing traffic.
- ROI is calculated by comparing the revenue gained (or costs saved) against the cost of implementing changes.
- Track specific KPIs like task completion rate, time-on-task, support ticket volume, and conversion rate to quantify impact.
- Even small improvements in comprehension can produce outsized revenue gains when applied to high-traffic pages.
Why ROI matters for accessibility
Most businesses treat accessibility as a compliance checkbox. That framing kills investment. When you frame cognitive accessibility as a conversion lever, the budget conversation changes entirely.
Return on investment (ROI) for accessibility works the same way it does for any other business initiative: you compare what you gained against what you spent. The formula is straightforward:
ROI = (Net Benefit - Cost of Investment) / Cost of Investment x 100
The tricky part is not the math. It is identifying and isolating the benefits. A clearer headline on your pricing page does not show up as a line item in your revenue report. But it does show up in your conversion rate, your bounce rate, and your customer acquisition cost.
That number is not hypothetical. Nearly half of all web visitors encounter cognitive barriers that slow them down or push them away. When you fix those barriers, you capture revenue that was already sitting on the table.
Quantifying cognitive accessibility benefits

Quantifying benefits starts with identifying where cognitive friction costs you money. Here are the primary benefit categories:
- Increased conversion revenue. Clearer copy, simplified forms, and reduced cognitive load translate directly into more signups, purchases, or demo requests. If your landing page converts at 2.5% and a cognitive accessibility overhaul pushes it to 3.2%, you can calculate the exact revenue difference.
- Reduced support costs. Confusing interfaces generate support tickets. Every ticket costs between $5 and $25 to resolve depending on your support model. Fewer confused users means fewer tickets.
- Lower customer acquisition cost (CAC). When more of your existing traffic converts, your effective CAC drops without changing your ad spend.
- Improved retention. Users who understand your product during onboarding stick around longer. A 5% improvement in onboarding comprehension can shift your churn curve meaningfully over 12 months.
- Reduced legal and compliance risk. Accessibility lawsuits in the US exceeded 4,600 filings in recent years. Proactive cognitive accessibility work reduces exposure.
Key performance indicators to track

You cannot improve what you do not measure. These are the KPIs that connect cognitive accessibility work to business outcomes:
- Conversion rate on modified pages (before vs. after)
- Bounce rate on landing pages and key entry points
- Task completion rate for critical user flows (signup, checkout, onboarding)
- Time-on-task for key actions (shorter is usually better for transactional flows)
- Form abandonment rate on signup and checkout forms
- Support ticket volume related to confusion or usability issues
- Net Promoter Score (NPS) or customer satisfaction scores
- Error rate during form completion or multi-step processes
- Pages per session and session duration (context-dependent)
"The accessibility problems of today are the mainstream breakthroughs of tomorrow.Eve Andersson, Director, Accessibility Engineering, Google.">, Metrics to measure the ROI of web accessibility
Here is an example dashboard showing what a typical SaaS company might track after implementing cognitive accessibility improvements on their pricing and signup pages:
Cognitive Accessibility ROI Tracker
Example: SaaS pricing page after accessibility overhaul (30-day window)
Step-by-step ROI calculation
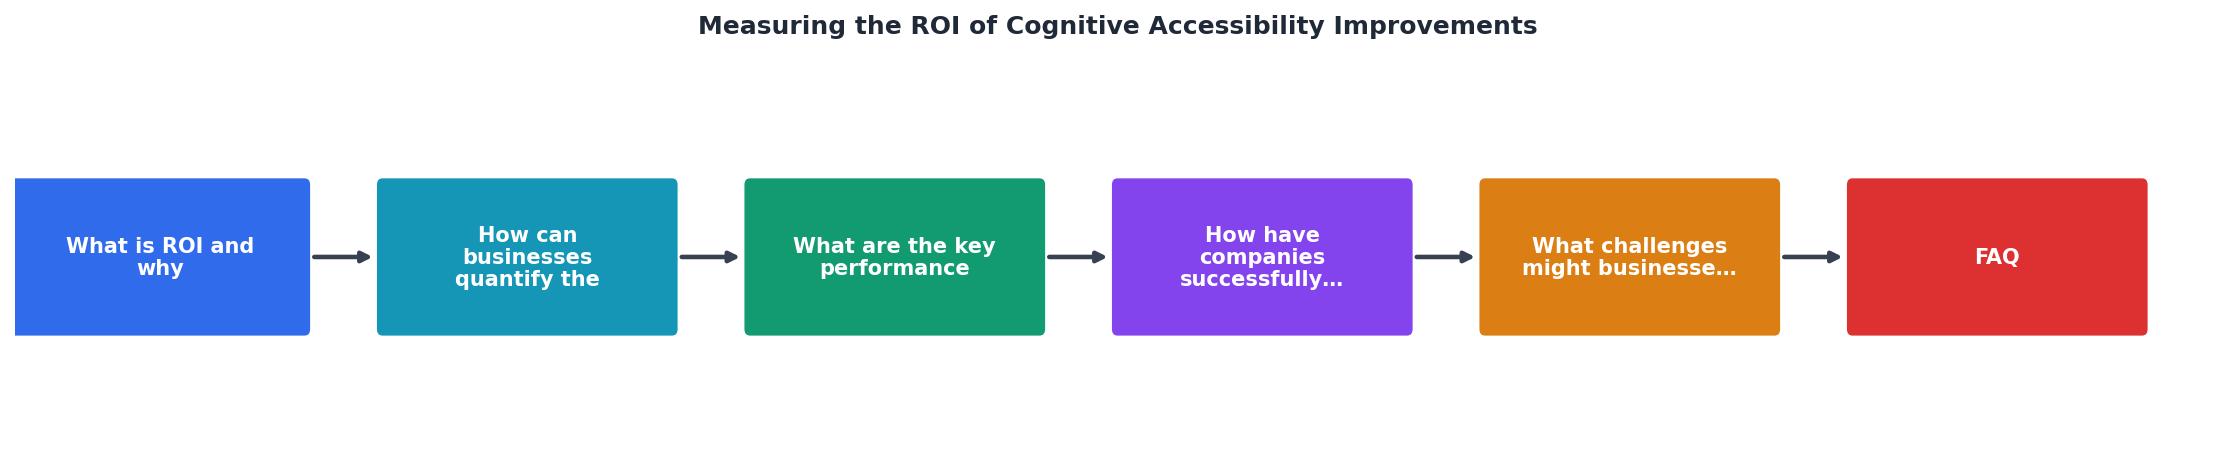
Here is how to calculate ROI for a specific cognitive accessibility project. Follow these steps in order:
Step 1: Baseline your metrics. Record current conversion rate, bounce rate, task completion rate, and support ticket volume for the pages you plan to improve. Use at least two weeks of data to smooth out daily fluctuations.
Step 2: Identify and cost the improvements. List every change: rewriting headlines, simplifying navigation, restructuring forms, adding visual cues. Assign a cost to each (designer hours, developer hours, copywriter fees, tool subscriptions).
Step 3: Implement and A/B test. Deploy changes to a percentage of traffic. Run the test for a minimum of two weeks or until you reach statistical significance.
Step 4: Measure post-change metrics. Collect the same KPIs from Step 1 on the improved version.
Step 5: Calculate net benefit. Convert metric improvements into dollar values:- Extra conversions x average revenue per conversion = additional revenue
- Reduced support tickets x cost per ticket = support savings
- Lower bounce rate x estimated value per engaged visitor = recovered opportunity
Step 7: Document and report. Create a one-page summary showing before/after metrics, total investment, total return, and ROI percentage. This becomes your business case for the next round of improvements.
Real-world ROI examples

Concrete numbers make the case better than theory. Here are patterns observed across SaaS and e-commerce companies that invested in cognitive accessibility:
Simplified checkout flow. An e-commerce company reduced their checkout from five steps to three, rewrote button labels to be action-specific ("Place Order" instead of "Submit"), and added progress indicators. Form abandonment dropped by 35%. On $2M monthly revenue, that translated to roughly $180K in recovered annual sales against a $12K implementation cost.
Rewritten onboarding sequence. A B2B SaaS product replaced jargon-heavy onboarding screens with plain-language instructions and added contextual tooltips. Trial-to-paid conversion increased by 1.8 percentage points. With 3,000 monthly trial signups and a $49/month plan, that added approximately $31K in monthly recurring revenue.
Restructured pricing page. A SaaS company reorganized their pricing page to reduce cognitive load: fewer plan options, clearer feature comparisons, and a recommendation badge on the most popular plan. Conversion rate on the pricing page went from 4.1% to 5.6%. The project cost $8,500 in design and development time and generated an estimated $14K in additional monthly revenue.
Tools like PagePerson Insights can help you identify which specific cognitive barriers exist on your pages before you start fixing them, so you invest in changes that actually move the needle.
Common challenges and how to solve them
Measuring ROI for cognitive accessibility is not always clean. Here are the obstacles you will hit and how to handle them:
- Attribution complexity. Multiple changes ship at once, making it hard to isolate which improvement drove results. Solution: Test one change at a time when possible, or use multivariate testing to separate effects.
- Long feedback loops. Some benefits (reduced churn, improved brand perception) take months to materialize. Solution: Track leading indicators (task completion rate, time-on-task) alongside lagging indicators (revenue, retention).
- Lack of baseline data. You cannot calculate improvement without a starting point. Solution: Instrument your key pages with analytics and event tracking before making changes. Even two weeks of baseline data is better than none.
- Stakeholder skepticism. Some executives view accessibility as a cost center, not a revenue driver. Solution: Lead with conversion data, not compliance language. Show the dollar value of recovered conversions.
- Small sample sizes. Low-traffic pages need longer test periods to reach statistical significance. Solution: Focus initial efforts on your highest-traffic pages where you can get reliable data fastest.
ROI Calculation Checklist for Cognitive Accessibility
Your progress is saved automatically in your browser.
FAQ
Frequently Asked Questions
What is the first cognitive barrier on your site that you suspect is costing you conversions? Start there, measure the before and after, and let the numbers make the case for the next fix.
Additional Resources
- Measuring Accessibility ROI: Breaking the Cycle - The accessibility ROI loop is simple: 1. You understand the benefits of accessibility → that helps you secure budget. 2. You use that budget to ...
- Metrics to measure the ROI of web accessibility - Every dollar invested into web accessibility and user experience improvements brings back $100, which gives a return on investment, or ROI, of 99%.
- Accessibility ROI: KPIs That Prove the Business Impact - The Core KPIs that Measure Accessibility ROI · 1. Number of Accessibility Errors · 2. Conversion Rate Improvements · 3. Audience Reach · 4. Legal ...