How to Read Comprehension Scores on a Landing Page
Your landing page looks clean, the copy feels sharp, and paid traffic keeps flowing in. But conversions stay flat. The problem is not design or traffic volume. It is that a significant chunk of visitors cannot understand what you are offering fast enough to act.

Your landing page looks clean, the copy feels sharp, and paid traffic keeps flowing in. But conversions stay flat. The problem is not design or traffic volume. It is that a significant chunk of visitors cannot understand what you are offering fast enough to act. Comprehension scores give you the missing diagnostic layer, and learning to read them correctly turns vague bounce-rate anxiety into a concrete fix list.

- Comprehension scores measure how easily a visitor can understand your landing page text, layout, and calls to action.
- A score below 60 on most readability scales signals that a large portion of your audience will bounce before they grasp your offer.
- Reading these scores means checking readability grade level, cognitive load indicators, and section-by-section breakdowns, then prioritizing fixes by conversion impact.
What comprehension scores actually measure
A comprehension score is not a single number. It is a family of metrics that quantify how much mental effort a reader needs to extract meaning from your page. The most common components include:
- Readability grade level (Flesch-Kincaid, Coleman-Liau, Gunning Fog): estimates the school grade a reader needs to understand the text.
- Cognitive load indicators: sentence length, clause density, jargon frequency, and visual complexity.
- Scannability rating: how quickly a visitor can skim headings, bullets, and bold text to find the answer they came for.
- Task clarity: whether the primary call to action is obvious within the first few seconds.
Why this matters for conversion

Heatmaps tell you where people click. Analytics tell you when they leave. Neither tells you why they left confused. Comprehension scores fill that gap.
Consider a SaaS landing page selling a project management tool. The hero headline reads: "Orchestrate cross-functional workflows with AI-augmented sprint velocity tracking." That sentence scores a Flesch-Kincaid grade level of 17. A visitor with a busy afternoon and three competing tabs will not decode it. They will click back to Google.
"Customers using Wynter's message testing have reported conversion improvements, including a documented 15% increase after one test.">, Landing Page Testing: How to Test Your Copy Before You Spend (2026)
A 15% lift from a single round of copy testing is not unusual. The first step in that process is knowing which sections score poorly. That is exactly what comprehension scores reveal.
Three reasons founders should care right now:
- Paid traffic costs keep climbing. Every confused visitor is wasted ad spend.
- Attention spans are shrinking. Visitors give you 5-8 seconds before deciding to stay or leave.
- Accessibility regulations are expanding. The European Accessibility Act and updated WCAG guidelines increasingly address cognitive accessibility, not just visual contrast.
Common mistakes when reading scores

Most people check a single readability number, feel good or bad about it, and move on. That approach misses the point entirely.
Mistake 1: Treating the score as a single page-wide average. A landing page has distinct zones: hero, benefits, social proof, pricing, CTA. One zone can score well while another tanks. Always look at section-by-section breakdowns.
Mistake 2: Optimizing only for Flesch-Kincaid. Flesch-Kincaid measures syllable count and sentence length. It does not measure jargon familiarity, visual clutter, or whether your CTA button text makes sense. Use it as one input, not the only input.
Mistake 3: Dumbing down copy instead of clarifying it. A low score does not mean "use shorter words." It means "reduce the effort to understand." Sometimes that means replacing a technical term. Sometimes it means adding a subheading, breaking a paragraph, or moving a definition closer to where the term appears.
Mistake 4: Ignoring the audience baseline. A developer tools landing page can tolerate higher complexity than a consumer health app. Know your audience's expected reading context before you set target thresholds.
Step-by-step: reading your scores

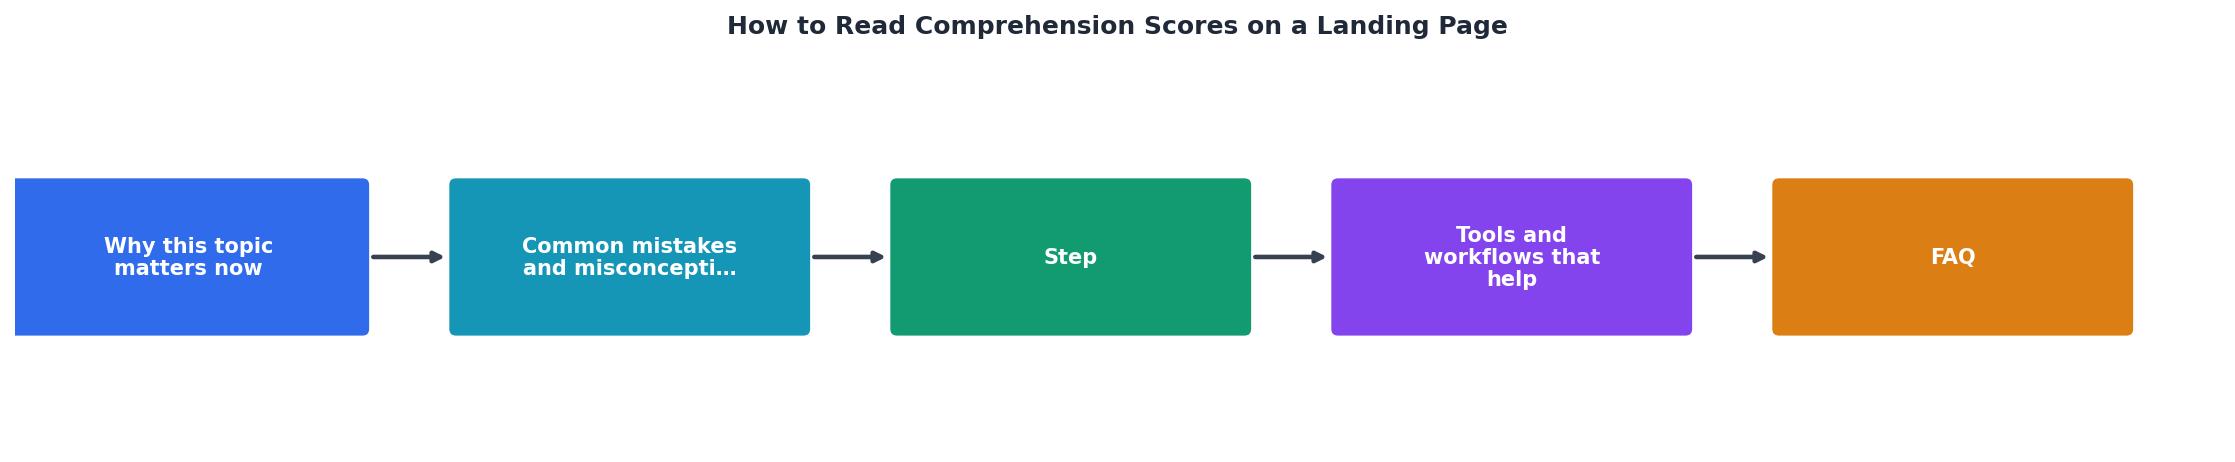
Here is the process, broken into five concrete steps. Each one builds on the previous.
1. Run the analysis
Open your landing page in a comprehension analysis tool. PagePerson Insights, for example, runs directly in Chrome and breaks down cognitive accessibility barriers section by section. Hemingway Editor and Readable.com handle raw text readability. Pick one and run it.
2. Check the overall grade
Look at the top-level readability grade. For most B2B SaaS pages, aim for grade 8-10. For consumer products, aim for grade 6-8. If your page scores above 12, you have work to do.
3. Identify problem sections
Drill into the section-level scores. Common trouble spots:
- Hero headline and subheadline: often packed with jargon or compound clauses.
- Feature descriptions: tend to use internal product language instead of customer language.
- Pricing section: frequently overloaded with footnotes, conditions, and ambiguous tier names.
- Footer and legal text: ignored by most teams, but visitors do read it when they are uncertain.
4. Map scores to visitor behavior
Cross-reference low-scoring sections with your analytics. If the pricing section scores poorly and your funnel shows a drop-off right before checkout, you found the leak. If the hero scores poorly and bounce rate is high, the first impression is failing.
5. Prioritize and rewrite
Rank problem sections by two factors: how bad the score is and how much traffic that section receives. Fix the highest-impact section first. Rewrite, re-score, and compare.
Here is a quick reference for interpreting common score ranges on the Flesch Reading Ease scale:
| Score Range | Reading Ease | Typical Audience Fit |
|---|---|---|
| 90-100 | Very easy | 5th grader, broadest audience |
| 70-89 | Easy | 7th-8th grader, most consumers |
| 50-69 | Moderate | High school, informed B2B buyers |
| 30-49 | Difficult | College level, niche technical |
| 0-29 | Very difficult | Graduate/professional, very narrow |
For landing pages targeting a general audience, staying in the 60-80 range on Flesch Reading Ease is the sweet spot.
Tools and workflows that help
You do not need an expensive research lab. A practical workflow looks like this:
- Browser-based analysis: Run PagePerson Insights on your live page to get cognitive accessibility scores without copying text into a separate tool.
- Text-level readability: Paste key sections into Hemingway Editor (free) for sentence-level highlights.
- Message testing: Use Wynter or UsabilityHub to get real human feedback on whether your copy communicates what you think it does.
- A/B testing: Once you rewrite a section, run it as a variant in Google Optimize, VWO, or your existing A/B tool. Measure conversion lift directly.
The following card shows what a typical comprehension score dashboard looks like for a landing page with mixed results across sections:
Example: SaaS Landing Page Scores
In this example, the hero and CTA sections need immediate attention. The benefits and social proof sections are already performing well. That kind of section-level clarity is what makes comprehension scores actionable instead of abstract.
Your comprehension score checklist
Use this after every landing page audit or rewrite cycle.
Landing Page Comprehension Score Checklist
Your progress is saved automatically in your browser.
FAQ
Frequently Asked Questions
Additional Resources
- The Power of Landing Page Quality Scores - A landing page quality score is an estimation of the relevance and value of your landing page to the ads leading consumers there. Landing page quality scores ...
- Landing Page Testing: How to Test Your Copy Before You ... - A/B tests need traffic you don't have. How to test landing page copy with your ICP instead, the tools, and what improves conversions.
- Assessments - Reading | NAEP - The assessment measures reading comprehension by asking students to read selected grade-appropriate materials and answer questions based on what ...
Need Help with Accessibility?
Improve your site's accessibility and conversion rates with our AI-powered analysis.
Get Started