

Visitors land on your site, glance around for three seconds, and leave. Your analytics show drop-off, but not why. The culprit is usually not the offer, it's cognitive friction. Your navigation confuses them, your copy overwhelms them, your form asks too much too soon. The path from visitor to customer breaks somewhere in their head, not in your funnel. Fix that, and conversion rates climb.
Photo by Christina Morillo from Pexels
TL;DR:- Cognitive load, the mental effort required to navigate and understand your site, is the silent killer of conversion rates. Reducing it directly improves comprehension and action.
- Analyze user behavior data through heatmaps, session recordings, and drop-off funnels to spot where visitors get stuck.
- Simplify navigation, clarify content, and remove friction from forms and checkout flows to lower cognitive demands.
- Measure improvements using conversion rate, time-on-page, bounce rate, and task completion metrics.
Why focus on cognitive accessibility for conversion?
Most websites are designed by teams who know them intimately. You built the product, wrote the copy, organized the navigation. Of course it makes sense to you. But your first-time visitor has zero context. They're trying to understand what you do, whether it's for them, and how to take the next step, all while their attention spans fragments and their working memory fills with distractions.
Cognitive accessibility isn't a nice-to-have compliance checkbox. It's a conversion multiplier. Studies show that reducing cognitive load improves comprehension, trust, and action. When visitors understand your site faster, they convert faster. When they get lost, they bounce.
The link is simple: clearer is better. A visitor who grasps your value proposition in 10 seconds is far more likely to click, sign up, or buy than one who spends 30 seconds squinting at dense copy or hunting for the pricing page. Accessibility and conversion are not opposing forces, they're allies.
How to analyze user behavior data

Before you optimize, you need to see where your visitors stumble. Generic analytics (pageviews, bounce rate) tell you that people left, not why. You need qualitative data.
Start with heatmaps. Tools like Hotjar or Microsoft Clarity show where visitors click, scroll, and stop. If 80% of visitors scroll past your main CTA without clicking it, that's a signal. If clicks cluster on non-clickable elements (headlines, images), users are searching for something your page doesn't offer clearly.
Record session replays. Watch 5–10 real visitor sessions. Don't analyze, just observe. Do they look for something specific? Do they get confused by the layout? Do they re-read the same section twice? These micro-patterns reveal cognitive barriers your spreadsheet never will.
Map your funnel. Identify every step from landing page to conversion (signup, purchase, demo request). Then measure drop-off at each stage. If 40% of visitors reach the pricing page but only 5% click a plan, the friction is in pricing clarity, not traffic quality.
Use form analytics. Track which fields visitors abandon, how long they spend on each, where they pause. If 60% bail on the "Company size" dropdown, that field is creating friction, either it's unclear, the options don't fit, or it feels too invasive.
Test with real users. A/B test is good, but A/B test based on hypothesis. If you suspect visitors don't understand your value prop, test a clearer headline. If drop-off spikes after the first form field, test a single-field version that progresses step-by-step. Real-world data beats theory every time.
How to simplify website navigation

Navigation is the skeletal system of your site. If visitors can't find what they're looking for in two clicks, they're gone. The goal is not exhaustive, it's scannable.
Cut menu depth. Most sites over-organize. A visitor shouldn't need to click "Products > Enterprise > Features > Security" to find your security page. Flatten it. If you have more than 6–7 main items in your top navigation, you're asking too much. Group related items under clear parent categories, and make every page reachable in no more than 2–3 clicks.
Use plain language. "Solutions" is vague. "Pricing" is clear. "Enterprise Resources" requires a mental translation. "Guides & Docs" is immediate. Every navigation label should be instantly obvious to someone who's never visited your site. If you have to explain what a nav item means, it's the wrong label.
Prioritize the most common task. If 70% of your visitors come to buy, lead with pricing or product. If they come to learn, lead with resources or blog. Your navigation should reflect visitor intent, not organizational structure. Your internal team doesn't need the nav to work, your visitors do.
Create a breadcrumb trail. On deeper pages, show the path back: Home > Features > Security. It reassures visitors they're not lost and gives them an easy way to backtrack or jump to a parent section.
Use progressive disclosure. Don't show every option at once. On landing pages, show three main CTAs, not twelve. In forms, reveal fields as the visitor progresses, not all at once. This reduces cognitive load and speeds perceived progress toward conversion.
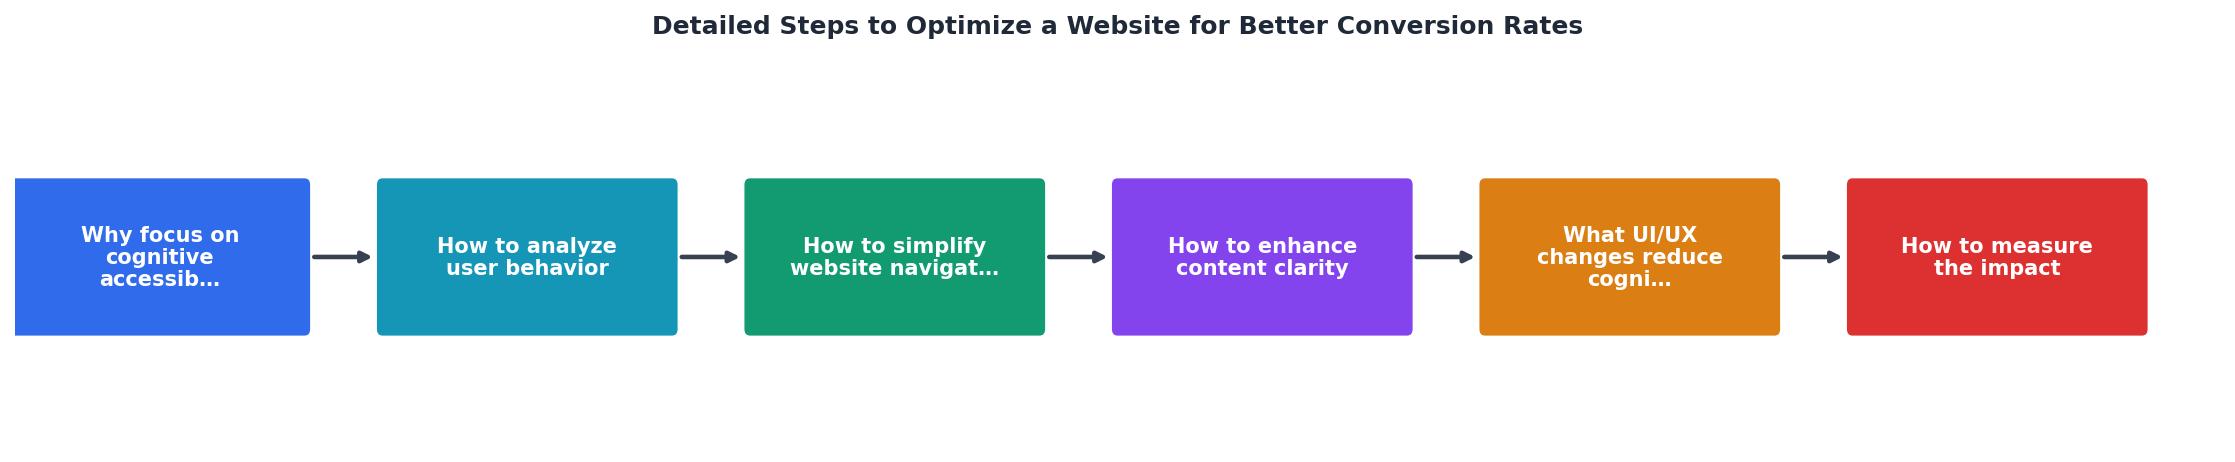
The process diagram below shows how these navigation principles fit together:
How to enhance content clarity

Clear copy converts. Murky copy confuses. The difference often comes down to specificity and structure.
Lead with the benefit. Don't start with a feature. "Our API integrates with your tech stack" is a feature. "Close deals 40% faster without manual data entry" is a benefit. The visitor's brain wants to know how this helps me, not what it does. State that first.
Use short sentences and paragraphs. Long paragraphs intimidate and slow reading. Aim for 10–15 words per sentence, 3–4 sentences per paragraph. White space is your friend. It makes copy feel less dense and easier to scan.
Remove jargon. If your industry uses jargon (SaaS, fintech, healthcare), assume your visitor doesn't. Define acronyms on first use. Replace technical terms with everyday language. "Provisioning" becomes "setting up." "Authentication" becomes "logging in." The simpler the word, the faster the brain processes it.
Use lists and labels. Features work better as bullet points than prose. Instead of: "Our system handles customer data, automates workflows, and integrates with your CRM," write:
- Centralize all customer data
- Automate routine tasks
- Connect to your favorite CRM tools
Show, don't tell. "Intuitive interface" is a claim. A screenshot showing the interface is proof. "Fast performance" is abstract. "Loads in under 500ms" is concrete. Numbers beat adjectives.
"The most valuable real estate on your website is the area of your homepage that shows before a visitor scrolls.">, 11 Simple Fixes to Improve Conversion Rates
Your above-the-fold section must answer three questions instantly: What is this? Is it for me? What do I do now? If a visitor has to scroll to find those answers, you've lost cognitive real estate.
What UI/UX changes reduce cognitive load?
Form friction is conversion friction. A three-field form converts better than a ten-field form, even if the ten-field version asks the exact same questions over multiple steps. Why? Perceived effort. One page of two fields feels quick. One page of ten fields feels like a commitment.
Progressive forms win. Ask for email first. Once they enter it, ask for name. Once they enter that, ask for company. Each screen feels small, beatable, non-threatening. The total fields are the same, but the cognitive load per screen is half.
Reduce decision paralysis. If your pricing page shows 47 plan variations, visitors freeze. Three tiers (Starter, Pro, Enterprise) allow comparison without overwhelm. If your product has twenty features, lead with the five that matter most. If your homepage has eight sections, cut it to four. Constraints clarify.
Use visual hierarchy. Make the most important element the biggest and boldest. If your CTA button is the same size as decorative text, visitors won't know where to look. Use color, size, and placement to guide eyes toward action. The visitor's eye should land on your headline, then your CTA, in that order, without hunting.
Reduce error recovery friction. If a form rejects an entry, don't clear the whole form. Show exactly what went wrong, "Email format incorrect" not "Error", and let them fix just that field. Every time a visitor has to re-enter data, you spike cognitive load and bounce risk.
Test for clarity, not cleverness. Animated micro-interactions and custom interactions are fun. They're also distracting. Standard patterns, buttons that look clickable, inputs that look enterable, links that look linky, reduce friction because visitors recognize them instantly. Stick to convention until you have a very specific reason to break it.
How to measure the impact of optimizations
You optimize to move the needle. That means defining what "moved" looks like before you start.
Conversion rate is the headline metric: signups, purchases, or your target action as a percentage of visitors. If you go from 2% to 3%, that's a 50% lift. Track this per page and per user segment.
Time on page tells you engagement. If visitors spend 20 seconds on your landing page before bouncing, that's a signal the page isn't holding attention. If optimization moves that to 45 seconds, it's working, people are reading more before deciding.
Bounce rate by page reveals friction. A 60% bounce rate on your pricing page is bad. A 20% bounce rate is good. If optimization drops it from 50% to 35%, that's real impact.
Task completion rate is gold. If you can measure how many visitors complete your core task (adding an item to cart, watching a demo video, filling a form), track that. Optimization should increase it.
Drop-off point in the funnel tells you where to focus next. If 30% of visitors land on your site but only 5% reach checkout, your biggest leak is early. Focus there before optimizing checkout.
A/B test methodically. Change one variable at a time, headline, form fields, CTA color, copy length. Wait for statistical significance (usually 100–200 conversions per variant). Then measure lift. Compound small wins: 10% here, 15% there, and your conversion rate climbs.
Start with high-impact changes. Simplifying navigation from 12 items to 6 might lift conversion 8%. Changing a button color might lift it 1%. Go after the 8% first.
Example: Conversion Metrics Before & After
The dashboard above shows real-world improvements from a typical optimization sprint. Notice that all metrics move together, better clarity leads to more time on page, which leads to higher conversion, which leads to better form completion. These aren't random; they're causally linked through reduced cognitive friction.
Steps to Simplify Website Navigation
Your progress is saved automatically in your browser.
FAQ
Frequently Asked Questions
Additional Resources
- 11 Simple Fixes to Improve Conversion Rates - 7. Fill out SEO Fields Properly ... If you don't have a few fields filled in properly, Google won't read your website correctly. It won't know ...
- How To Improve Your Conversion Rate (2026 Guide) - Learn how you can improve your website's conversion rate. Includes 20 actionable ways you can implement, best practices, real-world pro tips ...
- How to Increase Your Website Conversion Rates in 2025 - I am going to share the most fundamental conversion rate optimization tactics that you can Implement on your website to start driving more conversions.
Need Help with Accessibility?
Improve your site's accessibility and conversion rates with our AI-powered analysis.
Get Started