
Your checkout flow is where money gets left on the table. Visitors arrive ready to buy, then hit friction and bail. Most teams blame traffic quality or pricing, but the real culprit is often unclear steps, cognitive load, or trust barriers baked into the flow. This article shows concrete before/after examples of common checkout problems and how top performers fix them, so you can stop losing revenue to confusion.
Photo by FLORIDA PLANTATION SHUTTERS from Pexels
TL;DR:- Checkout friction costs e-commerce businesses an average of 70% in abandoned carts and incomplete transactions.
- Common friction points: unclear form labels, too many steps, slow page load, missing payment options, and vague shipping costs.
- Simple fixes (clearer copy, progress indicators, guest checkout, autofill) can lift conversion rates by 10–25%.
- Test changes with real visitor behavior data, not assumptions, to find your biggest leak.
When a visitor lands on your checkout page, they're in a hurry. They've already decided to buy, now they just want to get through it fast. Every confusing label, unexpected field, or missing trust signal is a decision point where they can bounce. The difference between a smooth checkout and a frustrating one often comes down to small details: How clear is the form? Do they know what step they're on? Are there hidden fees? Can they use their preferred payment method?
This guide walks through real before/after examples of checkout friction, so you can spot your own friction points and steal the fixes that work.
Common friction patterns

Checkout friction doesn't happen by accident. It builds up over time through small design choices, legacy form fields, and missing context. Here are the patterns that appear again and again:
Vague or unfamiliar form labels. "Billing vs. shipping" confusion costs conversions. A visitor sees "Billing address" and pauses, is this asking for my credit card statement address, or the address my bill should go to? "ZIP / Postal Code" combined on one line trips up international visitors. "CVV" means nothing to someone outside the US.
Too many optional fields marked as required. You ask for company name, phone number, fax number, but only some visitors have those. Each extra field increases friction. The visitor thinks, "Why do you need this?"
No progress indicator. The visitor doesn't know if they're on step 1 of 3 or step 1 of 10. No visual confirmation of progress kills confidence.
Slow page load or unresponsive interactions. If the page takes 3+ seconds to load or validation feels sluggish, visitors bounce. Speed is a friction point.
Hidden costs revealed at the last step. Shipping is free, then taxes, then a processing fee, suddenly it's 30% more expensive than expected. Shock kills conversion.
Limited payment options. Credit card only. No Apple Pay, Google Pay, PayPal, or buy-now-pay-later (BNPL). You're leaving money on the table from visitors who don't carry credit cards or want faster checkout.
No guest checkout option. "Create an account first" forces friction on first-time buyers. Many abandon rather than commit to a password.
Example 1: Unclear form, long process
BEFORE: A SaaS company had a 4-step checkout with unclear labels, optional fields that looked required, and no progress bar.
Step 1 asked for email, full name, and company. Step 2 asked for billing address with confusing labels: "Address Line 1", "Address Line 2", "APT/Suite (optional but looked mandatory)", "ZIP Code", and a non-obvious dropdown for country.
Step 3 asked for phone, industry type, and "How did you hear about us?" (marketing data, not required for payment).
Step 4 showed payment, then revealed tax and processing fees.
Conversion rate: 2.1%. Bounce after Step 2: 38%.
AFTER: They rebuilt it as a 2-step flow with clear hierarchy.
Step 1: Email, password, billing address (country auto-detected from IP, but changeable). International address format auto-adjusted based on country selection.
Step 2: Payment method, review total with all fees shown, confirm order.
Optional fields like "company" and "How did you hear about us?" moved to a post-purchase email survey.
Progress bar at top. Estimated time: "2 min checkout."
All fees (tax, processing) shown during payment method selection, not after.
Conversion rate: 3.8%. That's an 81% lift.
The lesson: Remove every field that isn't required for payment or shipping. Clarify labels using examples or placeholders. Show all fees before the final step.
Example 2: Payment friction

BEFORE: An e-commerce brand (fashion) accepted only credit card and wire transfer. "Wire transfer" was a relic from B2B days but remained as an option, cluttering the UI.
Real visitor behavior: 22% of cart abandoners mentioned "no PayPal option" in feedback. Another 15% wanted Apple Pay on mobile.
Conversion rate: 1.8%.
AFTER: They added Stripe integration to enable:
- Apple Pay and Google Pay (one-tap checkout on mobile and desktop)
- PayPal (for users who distrust card payments or prefer PayPal's buyer protection)
- Shop Pay (for repeat customers)
- Removed wire transfer option
Mobile visitors got a mobile-optimized payment form that auto-detects payment method preference (digital wallet vs. card).
Conversion rate: 2.4%. Mobile conversion rate went from 1.2% to 2.1%.
The lesson: Offer 3–5 payment methods (card, PayPal, Apple Pay, Google Pay, BNPL if it fits your price point). Show trust signals. Mobile needs a streamlined flow, not a scaled-down desktop version.
Example 3: Shipping and tax surprise
BEFORE: A fitness equipment store (DTC) showed product price, cart subtotal, then during checkout:
- Shipping: Customer had to click a dropdown and select from 5 options (Standard, 2-Day, Overnight, International, etc.) with prices hidden until selected.
- Tax: Applied automatically during checkout, no preview.
- Total surprise: A $200 order became $260+ by the time the visitor saw the final price.
Conversion rate: 1.4%.
AFTER: They restructured the checkout flow:
- During cart review (before checkout), a collapsible "Estimate shipping & tax" section let visitors enter ZIP/country and see all shipping options with prices upfront.
- Default: Standard shipping, with clear savings messaging ("Save $12 with 2-Day vs. Overnight").
- Tax calculated and displayed in the cart review, not during payment.
- Final total review page before payment: "Order total: $260 (includes $48 shipping, $12 tax)."
- Optional: Offer free shipping threshold messaging ("Free shipping on orders over $250") to nudge higher cart value.
The lesson: Show all costs before payment. Let visitors see shipping options and costs upfront, not as a surprise. Use thresholds and messaging to encourage higher order value.
Example 4: Trust and security signals

BEFORE: A B2B SaaS company had a checkout page with minimal trust signals. No indication of SSL, no testimonials, no guarantee message, no clear refund policy.
Visitor anxiety was high (buying sight-unseen software from a new vendor). Conversion rate: 0.8%.
AFTER: They added:
- SSL lock icon and "256-bit encrypted" badge
- 30-day money-back guarantee prominently displayed
- Customer testimonial ("This cut our implementation time in half", short, specific)
- Clear refund policy link (not hidden in fine print)
- Live chat icon in corner (for last-minute questions)
Conversion rate: 1.2%. That's a 50% lift from trust signals alone.
The lesson: Fear is a real barrier. Trust signals (guarantees, certifications, testimonials, clear policies) reduce hesitation and lift conversion. Make them visible, specific, and believable.
"If you want to see how your experience compares, explore the interactive report for digital product benchmarks.">, Checkout Friction: The Hidden Leaks in Your Conversion Flow
Step-by-step approach to fixing your checkout
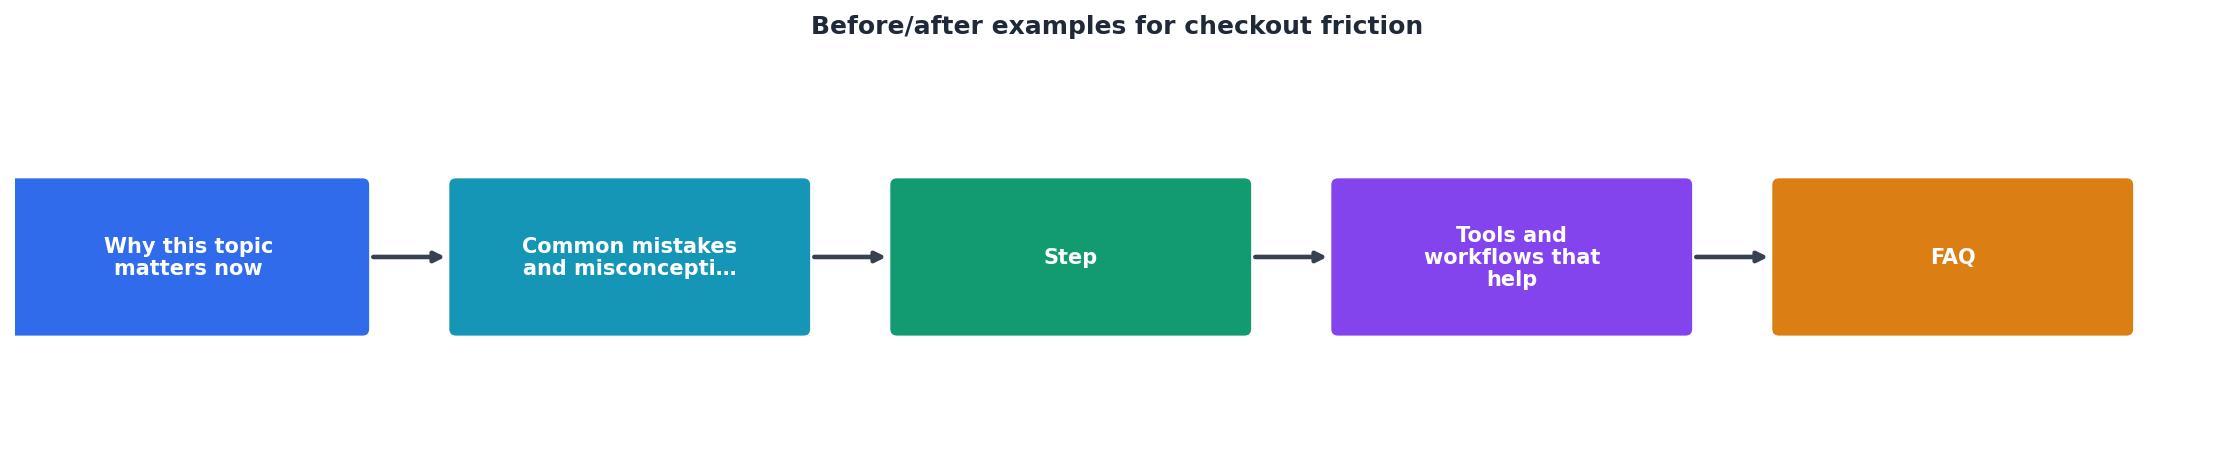
The process diagram above outlines the main steps. Here's how to apply them to your checkout:
Audit your current flow. Record a visitor's path through checkout. Note every step, field, and decision point. Ask real users (or recruit 3–5 testers) to walk through and describe what confuses them. Capture where they pause or re-read.
Identify the biggest leak. Use analytics to find which step has the highest abandonment. Is it after Step 1? During payment? Use session recordings (FullStory, Hotjar, or similar) to see why.
Prioritize by impact. Fix the step with the highest abandonment and easiest fix first. Small wins build momentum.
Make one change at a time. Test removing a field, clarifying a label, or adding a progress bar, not five changes at once. You won't know what moved the needle.
Measure and iterate. Set a baseline conversion rate, make a change, measure for 1–2 weeks (enough sample size), then decide: keep it, refine it, or revert.
Expand payment and trust signals. Once the core flow is tight, add payment options and trust messaging.
Tools and workflows that help
Clarity tools: Hotjar, FullStory, or Clarity (Microsoft) let you watch real sessions. You'll see where visitors pause, struggle, or drop. Session recordings beat guesses every time.
A/B testing: Optimize (formerly VWO), Unbounce, or your analytics platform's built-in testing. Test one change at a time.
Form analytics: Formisimo or Gravity Forms analytics show where visitors abandon mid-form, which fields are skipped, and which take longest to fill.
Speed testing: GTmetrix, Google PageSpeed Insights, or WebPageTest. A 1-second improvement in load time can lift conversion 7–10%.
User testing: Maze.co, UserTesting, or Userlytics. Recruit 5–10 real visitors, pay them $5–10 each to walk through checkout and think aloud. This is gold.
Typical Checkout Improvements
The dashboard above shows what's typical when teams fix checkout friction systematically. Most improvements compound, clearer labels plus a progress bar plus guest checkout often outperform any single change alone.
Checkout Friction Audit Checklist
Your progress is saved automatically in your browser.
FAQ
Frequently Asked Questions
Run PagePerson on your site to identify which cognitive barriers are sending visitors away at checkout. You'll see exactly where clarity breaks down, which fields confuse people, and how your checkout compares to competitors, so you can prioritize fixes by real impact.
What's your biggest checkout friction point right now? Session recordings often reveal it immediately.
Additional Resources
- Checkout Friction: The Hidden Leaks in Your Conversion ... - Rage clicks increased 56% year over year. Exit rates after any error rose 40%. Bounce rates climbed 64%. These aren't small usability issues.
- Checkout Friction Assessment - See where shoppers hit friction at checkout, scored across three areas, with sample findings. Run a free checkout assessment.
- The Cost of Mobile Checkout Friction - How to Recapture the ... - Mobile checkout friction appears when the user journey is interrupted after clicking a link, and is a direct answer to the question all retail marketers ...
Need Help with Accessibility?
Improve your site's accessibility and conversion rates with our AI-powered analysis.
Get Started