Presenting Cognitive Accessibility Findings to Stakeholders
You ran the audit. You found real problems. Users with ADHD bounce from a checkout flow that buries the total cost in fine print. Visitors with low digital literacy abandon a form because the error messages read like system logs.

You ran the audit. You found real problems. Users with ADHD bounce from a checkout flow that buries the total cost in fine print. Visitors with low digital literacy abandon a form because the error messages read like system logs. Now you need the people who control the budget to care about what you found. That gap between evidence and action is where most cognitive accessibility work dies quietly, and this guide exists to close it.
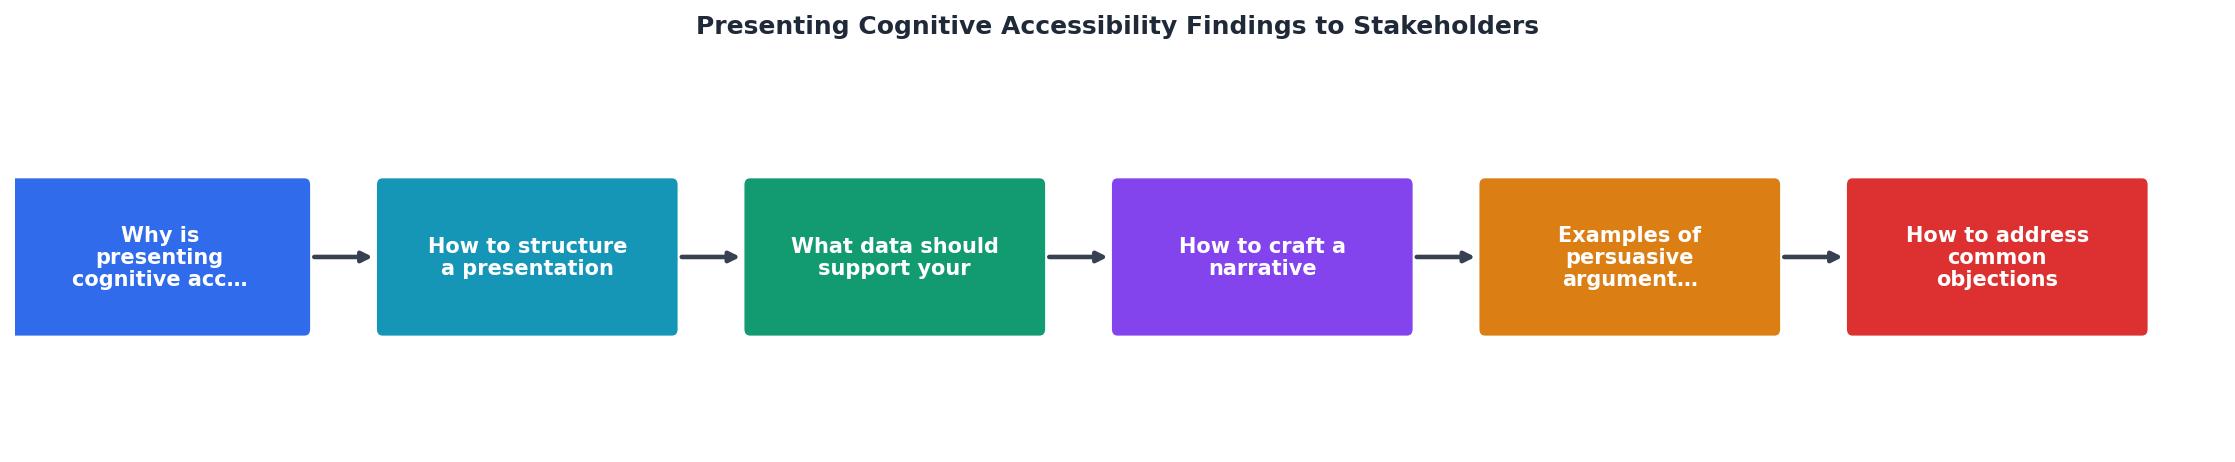
- Structure your presentation around user impact first, technical details second.
- Support every finding with measurable data: task completion rates, error rates, time-on-task, and conversion drop-offs.
- Craft a narrative that connects cognitive barriers to business outcomes stakeholders already track.
- Prepare specific responses for the three most common objections: cost, scope, and "we already do accessibility."
Why stakeholder buy-in matters
Cognitive accessibility improvements rarely ship without explicit approval. Unlike a color contrast fix that takes ten minutes, cognitive changes touch copy, layout, information architecture, and sometimes the product model itself. That means design reviews, engineering sprints, and content rewrites. None of that happens if a product manager or VP sees your findings as "nice to have."
The cost of inaction is concrete. When 42% of visitors potentially struggle with comprehension on a site, every week without a fix is lost revenue and excluded users. Framing cognitive accessibility as a user-experience debt that compounds over time gives stakeholders a mental model they already understand from technical debt conversations.
Structure your presentation
A 30-minute stakeholder presentation needs a clear skeleton. Here is a structure that works consistently:
- Hook (2 min): Open with one real user scenario. "A user with anxiety encounters five competing CTAs on the pricing page and closes the tab." Specific beats generic.
- Scope (3 min): State what you audited, which pages or flows, and the methodology. Mention tools like PagePerson Insights if you used them to gather cognitive load data.
- Findings (10 min): Present the top 3-5 issues ranked by severity and user impact. Each finding gets: the problem, who it affects, evidence (screenshot, metric, recording), and a proposed fix.
- Business case (5 min): Connect findings to KPIs the room cares about. Conversion rate, support ticket volume, bounce rate, time-to-task-completion.
- Roadmap (5 min): Show a phased plan. Quick wins in Sprint 1, medium-effort fixes in Sprint 2-3, structural changes in the quarter.
- Ask (5 min): Be explicit. "I need approval to add these five tickets to the next sprint" is better than "we should think about accessibility."
Data that supports your claims
"It feels confusing" gets a nod. "Task completion dropped 34% when we added the second confirmation modal" gets a budget line. The difference is data.
Key metrics to collect before your presentation:
- Task completion rate: Percentage of users who finish a flow (signup, checkout, onboarding). Segment by cognitive profile when possible.
- Error rate: How often users trigger validation errors, hit dead ends, or use the back button repeatedly.
- Time-on-task: How long a flow takes versus the design intent. A 2-minute checkout that averages 7 minutes signals cognitive friction.
- Bounce rate by page: Pages with high cognitive load often show exit rates 20-40% above site average.
- Support ticket themes: Filter tickets for phrases like "I don't understand," "where do I find," or "it won't let me." These are cognitive accessibility signals hiding in plain sight.
"The WCAG 2.0 are what appear in most policies, and are organised around the acronym POUR [18], as illustrated in Figure 2, on the following page.">, The State of Web Accessibility for People with Cognitive Disabilities: A Rapid E
This quote highlights a critical gap: most policies reference WCAG's Perceivable, Operable, Understandable, and Robust principles, but cognitive accessibility often falls through the cracks of standard audits. Your presentation should acknowledge this framework while showing where cognitive issues live beyond it.
Craft a narrative around impact
Data alone does not persuade. Stakeholders remember stories. The most effective cognitive accessibility presentations pair every data point with a human moment.
Three narrative techniques that work:
- The before/after walkthrough. Screen-record a user struggling with the current flow, then show a prototype of the fix. Seeing someone hesitate, re-read, and eventually abandon is more convincing than any chart. Pair it with the metric: "This user represents the 28% who drop off at step 3."
- The persona scenario. Describe a realistic user: "A 55-year-old customer with mild cognitive decline tries to update their payment method. The current flow uses a three-column layout with 14-point grey text and no progress indicator." You are not naming a fictional character. You are describing a real demographic segment your product serves.
- The competitor comparison. Show how a direct competitor handles the same flow with clearer cognitive design. Stakeholders respond to competitive pressure. "Stripe's checkout uses a single-column layout with progressive disclosure. Ours shows everything at once."
Persuasive arguments that land
Different stakeholders respond to different angles. Match your argument to the room:
| Stakeholder | Primary concern | Argument that works |
|---|---|---|
| CEO / Founder | Revenue, growth | "Fixing these 5 issues could recover 12% of abandoned checkouts" |
| Product Manager | Roadmap, velocity | "Quick wins take 2-3 story points each and reduce support load" |
| Engineering Lead | Scope, complexity | "Most fixes are copy and layout changes, not architectural" |
| Legal / Compliance | Risk, regulation | "European Accessibility Act enforcement starts 2025, cognitive gaps are liability" |
The example dashboard below shows how a typical cognitive accessibility audit summary might look when presented to stakeholders. It maps findings to business metrics they already track.
Cognitive Accessibility Audit Summary
Handle common objections
Every presentation hits resistance. Prepare for these three:
"We already do accessibility."
Response: "Our current audits cover visual and motor accessibility well. Cognitive accessibility is a separate layer. Automated tools check contrast ratios and ARIA labels. They do not check whether a user with ADHD can parse a pricing page with four plan tiers, three toggle states, and footnotes in 11-point text."
"This will cost too much."
Response: "Seven of the thirteen findings are copy and layout changes. No backend work. The remaining six fit into two sprints. Compare that to the estimated 9-14% conversion recovery on the checkout flow alone."
"How do we know this is real?"
Response: Show the session recordings. Show the support tickets. Show the analytics segments. Cognitive accessibility findings are not theoretical when you have users on camera re-reading the same paragraph three times.
Stakeholder Presentation Checklist
Your progress is saved automatically in your browser.
FAQ
Frequently Asked Questions
Additional Resources
- The State of Web Accessibility for People with Cognitive ... - The overarching goal for the LIVE-IT project is to aggregate and valorise the insights and findings of different 'research lenses' on the relationship between ...
- Pilot Project Study: Inclusive Web- Accessibility for Persons ... - This section presents the findings from the literature review and stakeholder consultation on the research questions relating to what ...
- Cognitive Accessibility at W3C - Cognitive and learning disabilities impact how people process information. For example, they can affect people's perception, memory, language, attention, ...
Need Help with Accessibility?
Improve your site's accessibility and conversion rates with our AI-powered analysis.
Get Started